I received the following question this morning from a frustrated home buyer: We recently lost our second offer on a home to a all case buyer. I know that many other buyers have been at this longer than a year and spent far more than we have but before I get to that poverty point…
Category: Features
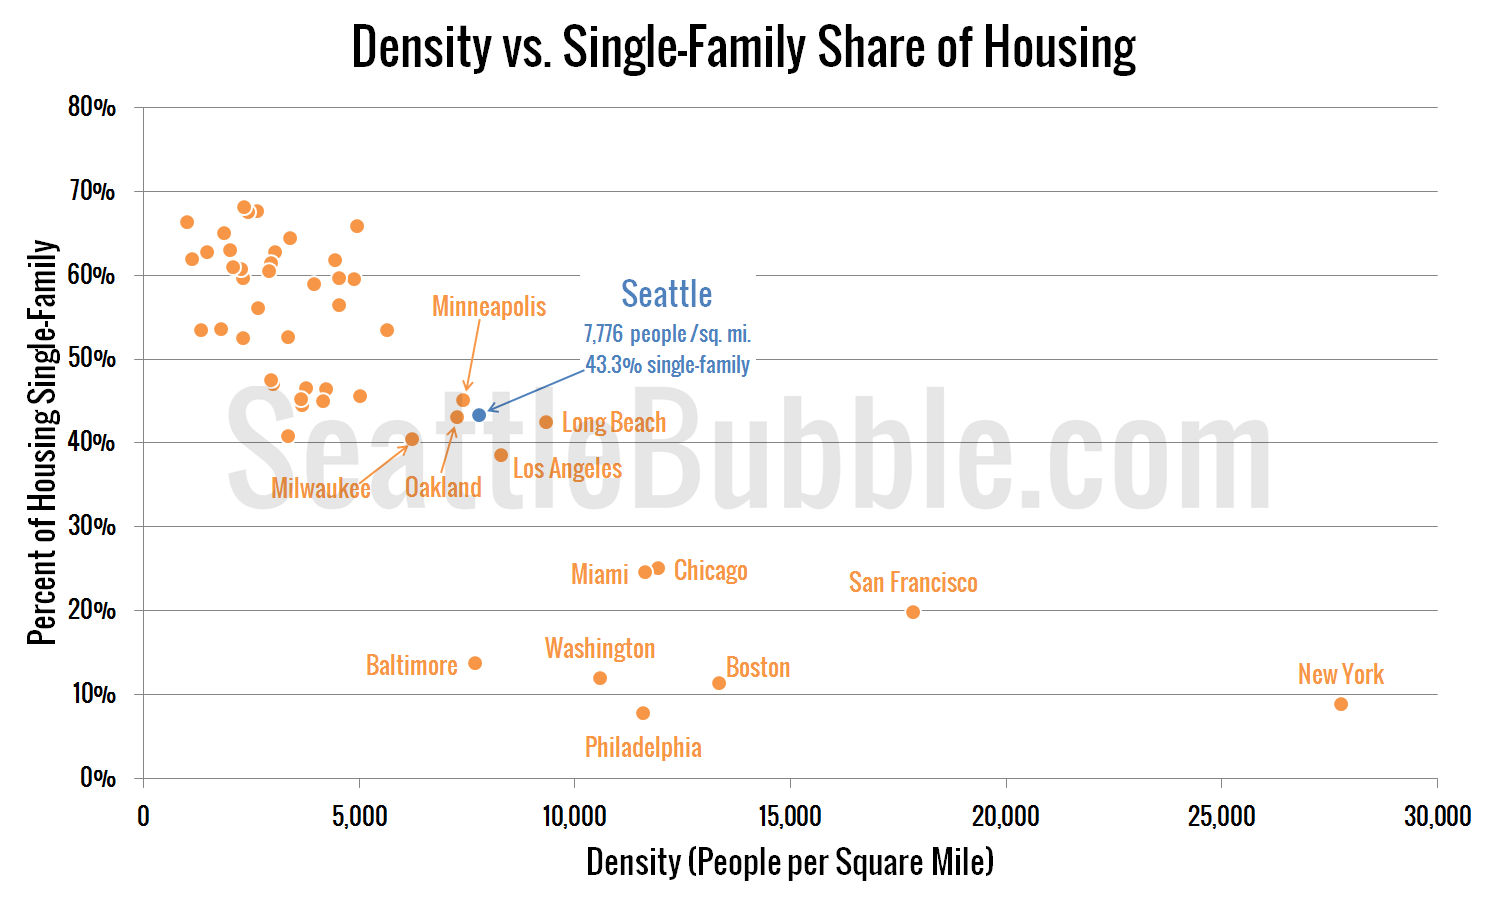
Kiss Single-Family Homes Goodbye if Seattle Keeps Growing
We usually talk about the whole Seattle metro area on these pages, but I’d like to take a little while to discuss an issue that is most relevant to Seattle proper: Density. There’s no denying that Seattle has been booming lately, thanks largely to serious growth in the local tech economy—unbridled growth at Amazon, the…
Warning: New Housing Bubble Ahead
This comment left by Ryan strikes me as a clear warning sign of another housing bubble inflating in Seattle. Just pulled the trigger on buying a townhouse in Fremont for $745k. Haven’t closed yet so don’t want to link to the MLS. Thought I would share my thinking on why I bought and what the…
Housing Bubble 2.0: The Perma-Bears Respond
Ben Jones, who has been blogging about the housing bubble from down in Arizona since late 2004 at The Housing Bubble Blog linked to my “Welcome to Housing Bubble 2.0” post yesterday, prompting an interesting discussion in the comments. Here’s a selection from the conversation that ensued: Comment by Ben Jones I’ve called this the…
Welcome to Housing Bubble 2.0
With home prices nearing their 2007 peak levels in the Seattle area (and no doubt exceeding them in some neighborhoods), I thought it would be good to step back from the monthly stats and take a big picture look at what’s going on in the housing market.
To answer the question of whether or not we are in another bubble, let’s compare and contrast the present frenzy to what the housing market went through during the Great Housing Bubble…