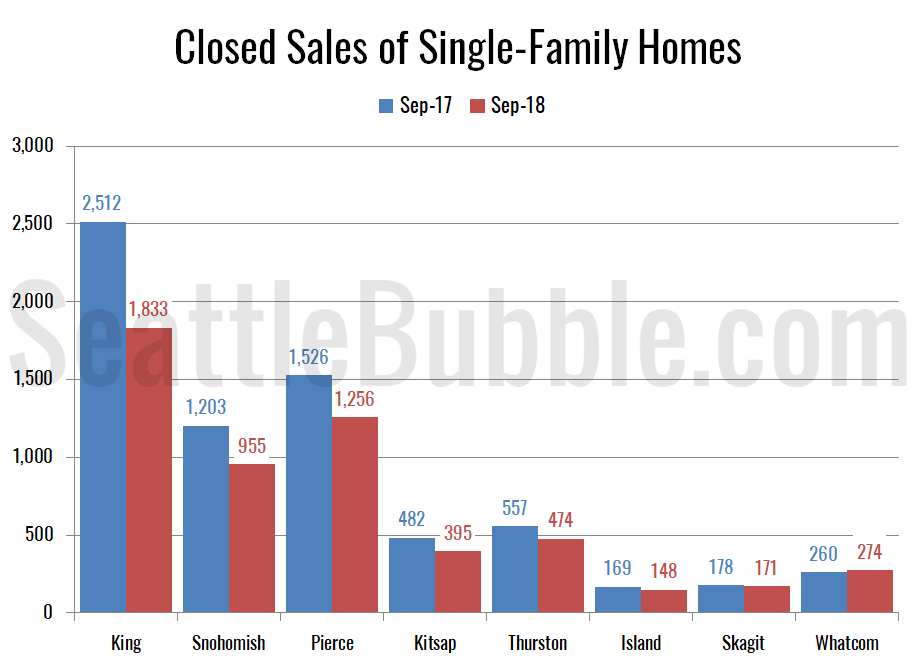
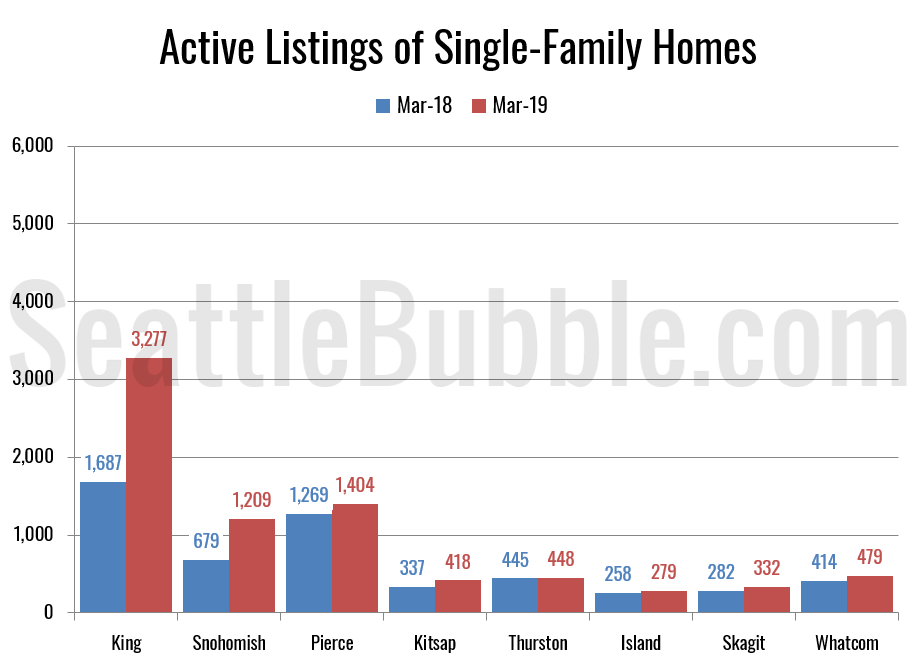
Let’s check in on the NWMLS statistics from around the sound.
Here’s where the YOY stats stand for each of the six counties as of June 2008:
King - Price: -4.3% | Listings: +25.4% | Sales: -27.2% | MOS: 6.0
Snohomish - Price: -9.0% | Listings: +8.1% | Sales: -35.0% | MOS: 8.0
Pierce - Price: -6.6% | Listings: [...]
Entries Tagged as 'graphs'
Puget Sound Counties June NWMLS Update
July 11th, 2008 · 66 Comments
Categories: Statistics
Tags: graphs, inventory, King_County, Kitsap, NWMLS, Pierce, sales, Skagit, Snohomish, Statistics, Thurston
May Neighborhoods Months of Supply Update
June 16th, 2008 · 18 Comments
Here’s the latest update on months of supply, or “absorption rates” for the 30 NWMLS areas in King County. For an explanation of what months of supply means, please refer to the original neighborhood MOS breakdown post.
Remember: Over 6 MOS is a buyer’s market, which gives buyers more negotiating power, but doesn’t mean homes [...]
Categories: Neighborhoods · Statistics
Tags: graphs, months of supply, Neighborhoods, NWMLS, Statistics
Puget Sound Counties May NWMLS Update
June 12th, 2008 · 30 Comments
Let’s check in on the NWMLS statistics from around the sound and see if the bottom is in yet for any of the seven Puget Sound counties we’re tracking.
Here’s where the YOY stats stand for each of the six counties as of May 2008:
King - Price: -6.2% | Listings: +41.7% | Sales: -38.7% | MOS: [...]
Categories: Statistics
Tags: graphs, inventory, King_County, Kitsap, NWMLS, Pierce, sales, Skagit, Snohomish, Statistics, Thurston
April Neighborhoods Months of Supply Update
May 16th, 2008 · 53 Comments
Here’s the latest update on months of supply, or “absorption rates” for the 30 NWMLS areas in King County. For an explanation of what months of supply means, please refer to the original neighborhood MOS breakdown post.
Remember: Over 6 MOS is a buyer’s market, which gives buyers more negotiating power, but doesn’t mean homes [...]
Categories: Neighborhoods · Statistics
Tags: graphs, months of supply, Neighborhoods, NWMLS, Statistics
Puget Sound Counties April NWMLS Update
May 8th, 2008 · 58 Comments
Let’s check in on the NWMLS statistics from around the sound. I realized this month that if I’m going to include Skagit County in the Puget Sound wrapup, I should probably include Island County as well. So from now on we’re looking at seven Puget Sound counties. I’d change the name of [...]
Categories: Statistics
Tags: graphs, inventory, King_County, Kitsap, NWMLS, Pierce, sales, Skagit, Snohomish, Statistics, Thurston
Buy Now, or Wait it Out?
May 1st, 2008 · 82 Comments
Now that prices are undeniably dropping in Seattle, a common refrain from real estate salespeople is that “you can’t time the bottom,” or “you can’t predict the future,” implying that you should go ahead and just buy now, because we’re probably at or near the bottom already, and if you wait you’ll be sorry.
This is [...]
Categories: Media · Statistics
Tags: bottom-calling, graphs, predictions
