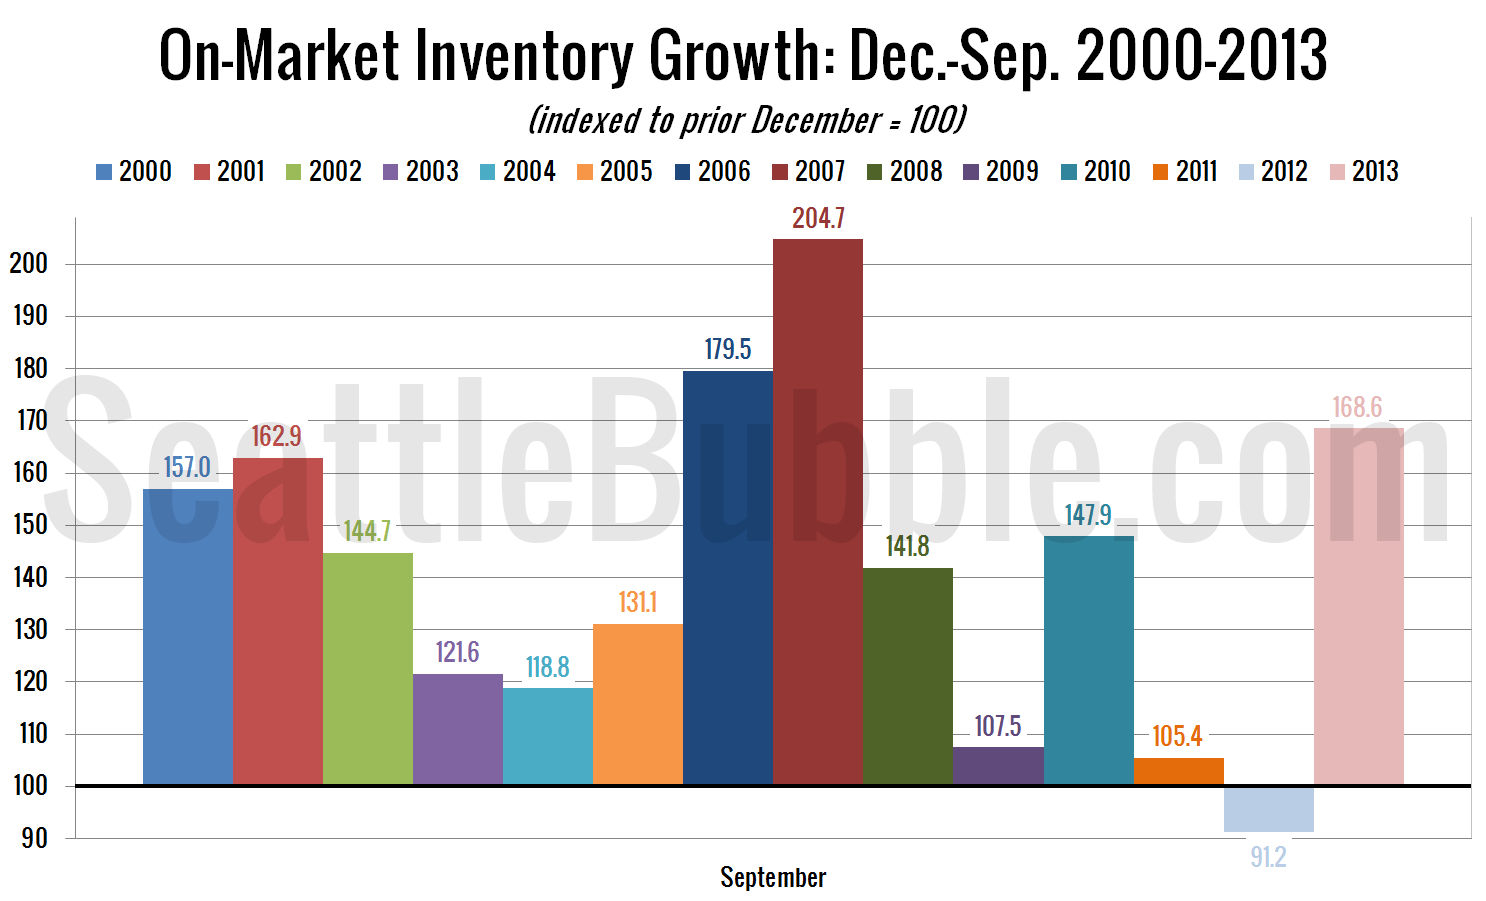
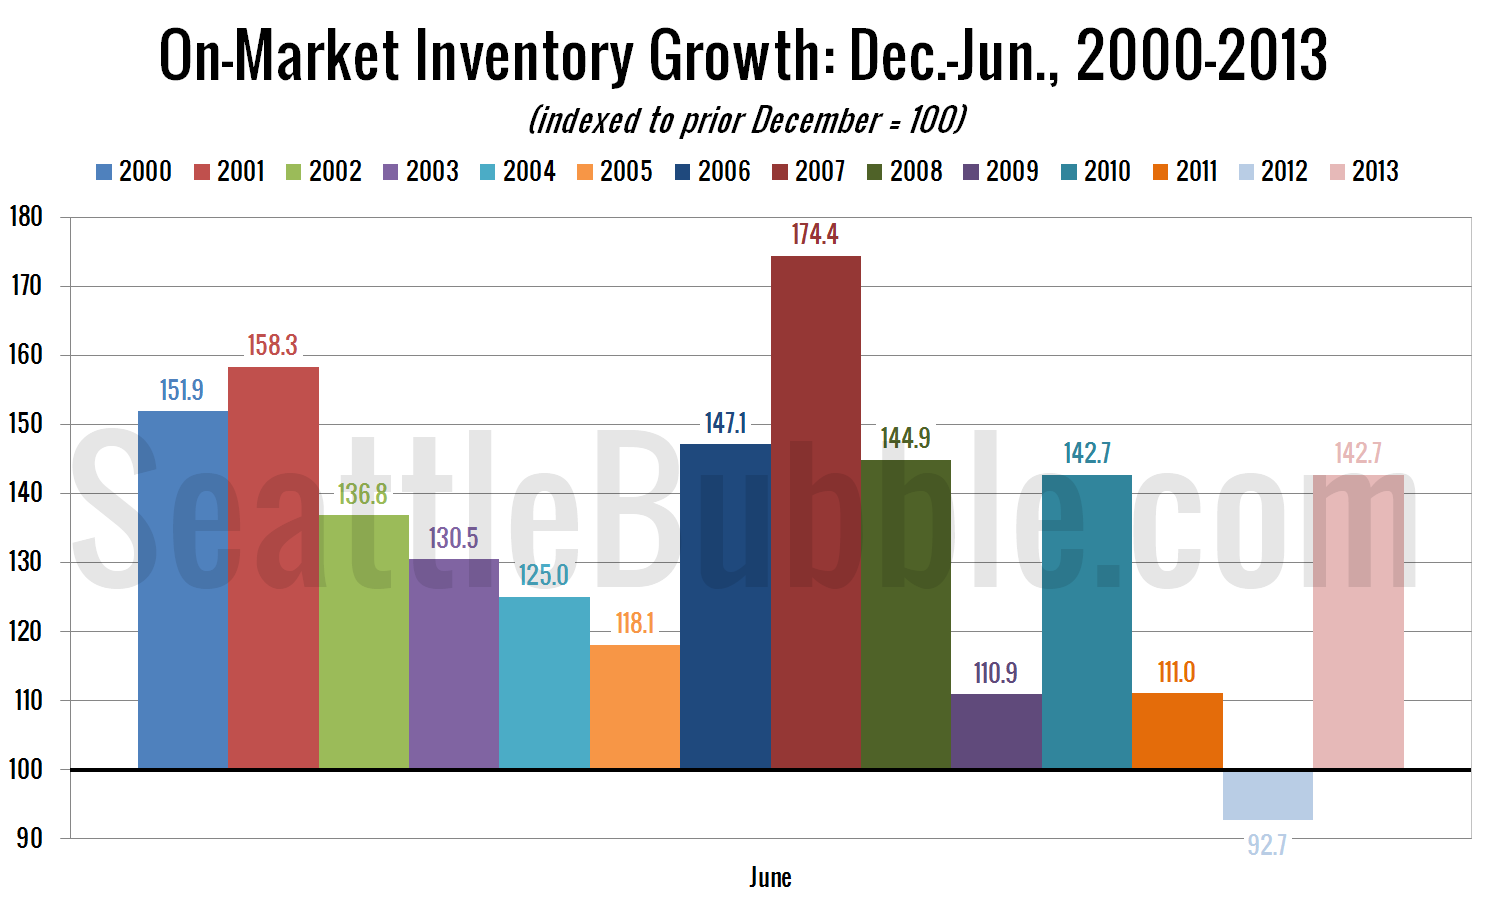
Let’s have a look at how listings are doing over the last few months. First up, here’s a view of how inventory has grown so far this year: Since 2013 started at a record-low level of homes on the market, inventory growth this year has been the largest since 2007, and the third-largest of any…
Tag: new listings
New Listings Continued Slow Recovery in August
Let’s have a look at how listings are doing over the last few months. First up, here’s a look at the last three months’ worth of new listings, comparing 2013 to every year I’ve got data for. June through August 2013 saw more new listings than the same period in 2012, 2011, 2010, and 2009….
New Listings Return to Levels that Outpace Pending Sales
Let’s take one more look at how listings are recovering over the last few months. This first chart shows the difference between the number of new listings each month and the number of pending sales. Prior to late 2011 this number was almost always positive, except in December, when very few new listings hit the…
Inventory Growth in 2013 is the Strongest Since 2008
Although total active inventory is still near record lows, here’s some good news: inventory growth so far in 2013 is the best we’ve seen since 2008: As of the end of June there were 42.72% more listings on the market than there were at the beginning of the year. That just barely edges out the…
Listings Keep Shrinking; Very Few Homes Delisted in 2012
Here’s a view on listings that we haven’t visited in a while. In this chart I use the NWMLS-published data on new listings, pending sales, and total inventory to visualize the inflow and outflow of single-family listings in King County. First up is a chart that goes back as far as NWMLS data is available:…