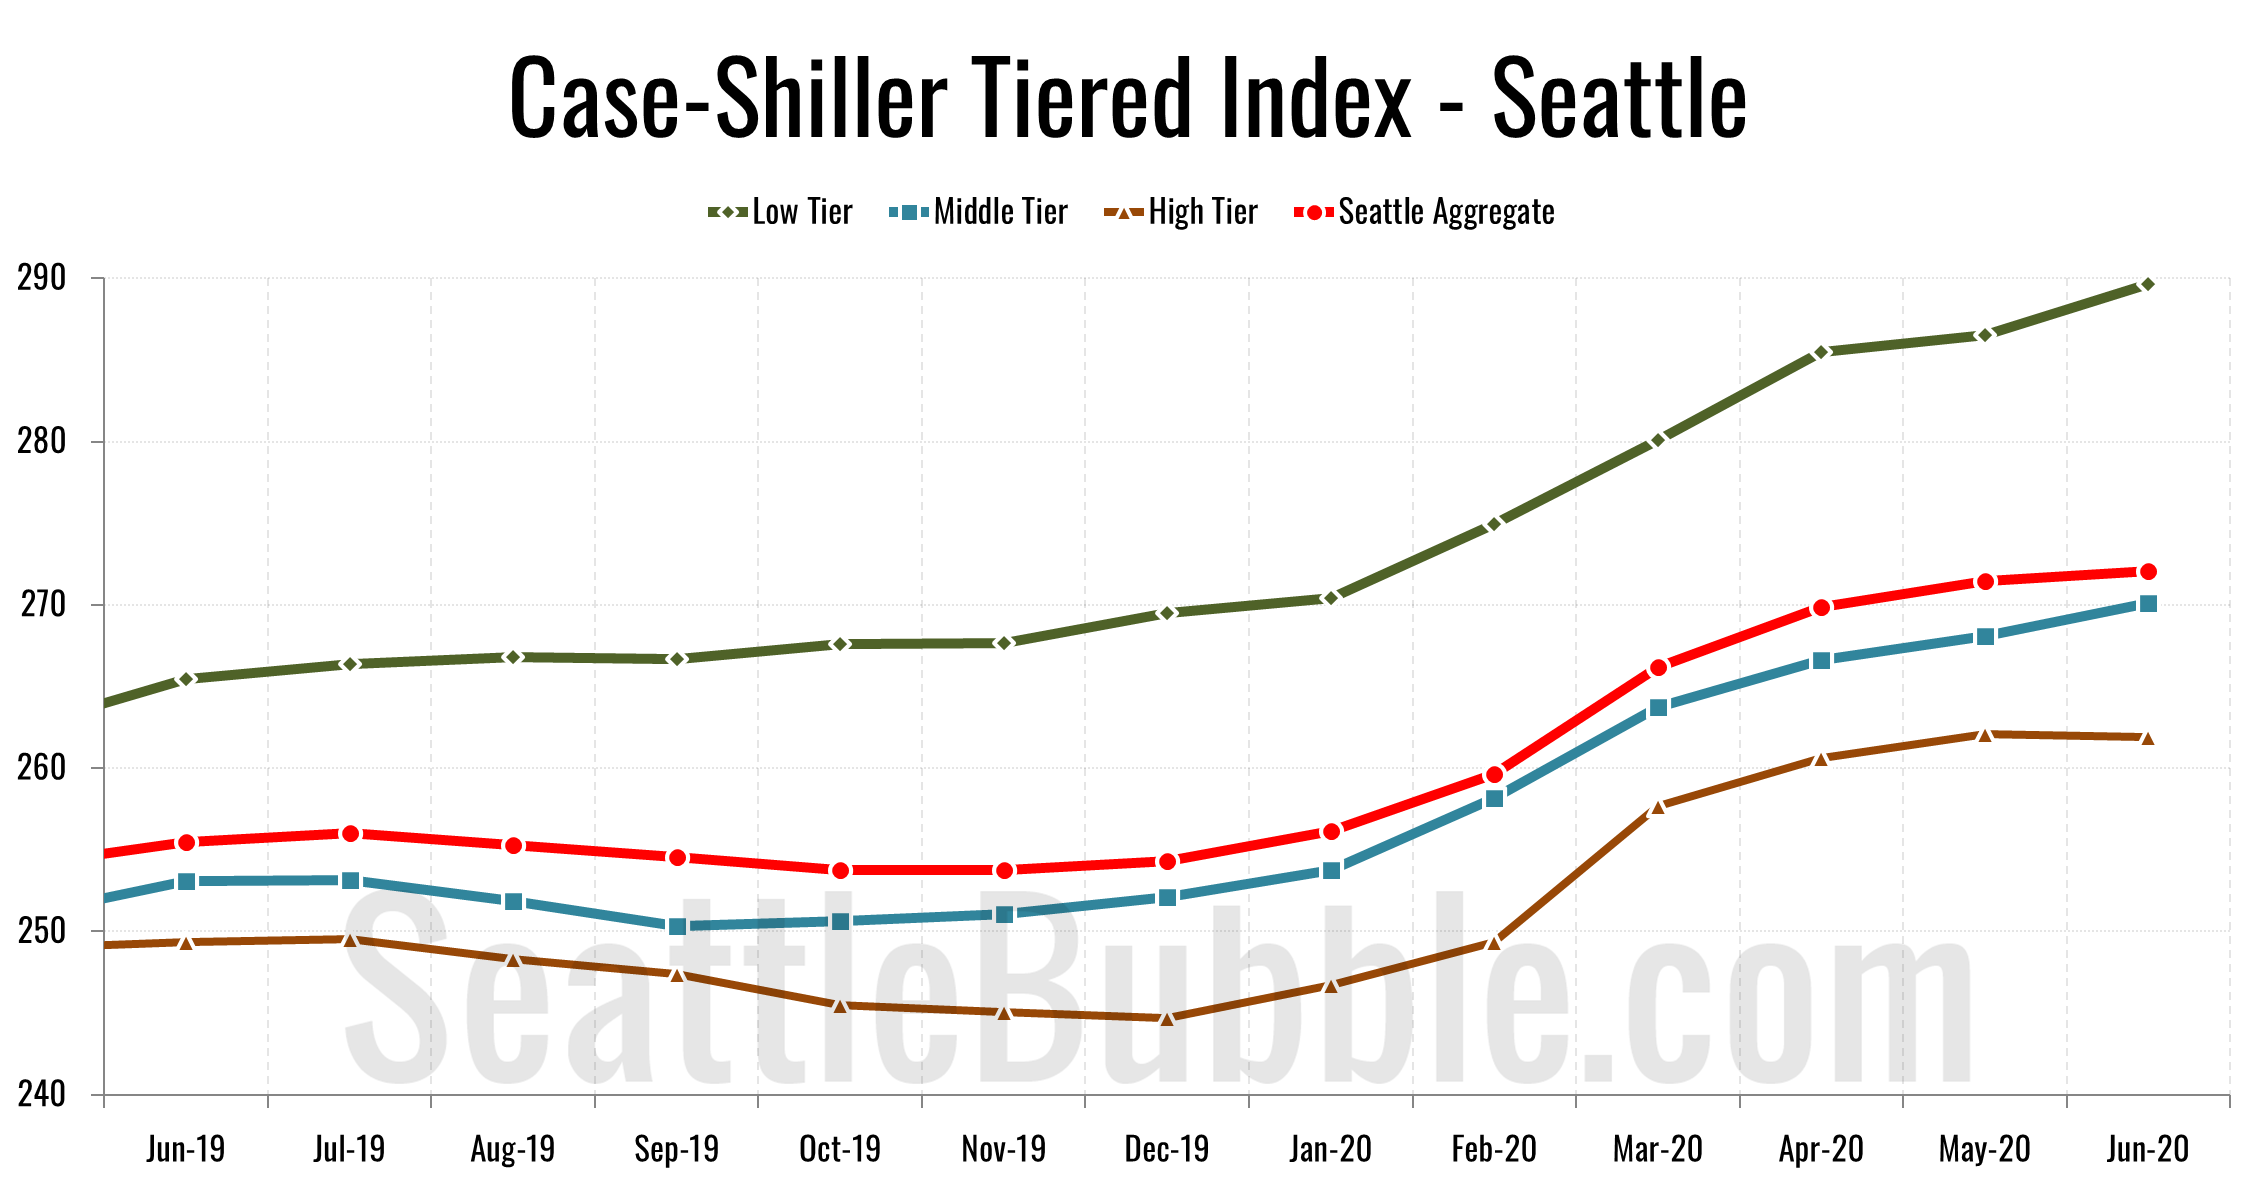
Let’s check out the three price tiers for the Seattle area, as measured by Case-Shiller. Remember, Case-Shiller’s “Seattle” data is based on single-family home repeat sales in King, Pierce, and Snohomish counties.
local real estate news, statistics, and commentary without the sales spin.
Let’s check out the three price tiers for the Seattle area, as measured by Case-Shiller. Remember, Case-Shiller’s “Seattle” data is based on single-family home repeat sales in King, Pierce, and Snohomish counties.
Let’s check out the three price tiers for the Seattle area, as measured by Case-Shiller. Remember, Case-Shiller’s “Seattle” data is based on single-family home repeat sales in King, Pierce, and Snohomish counties.
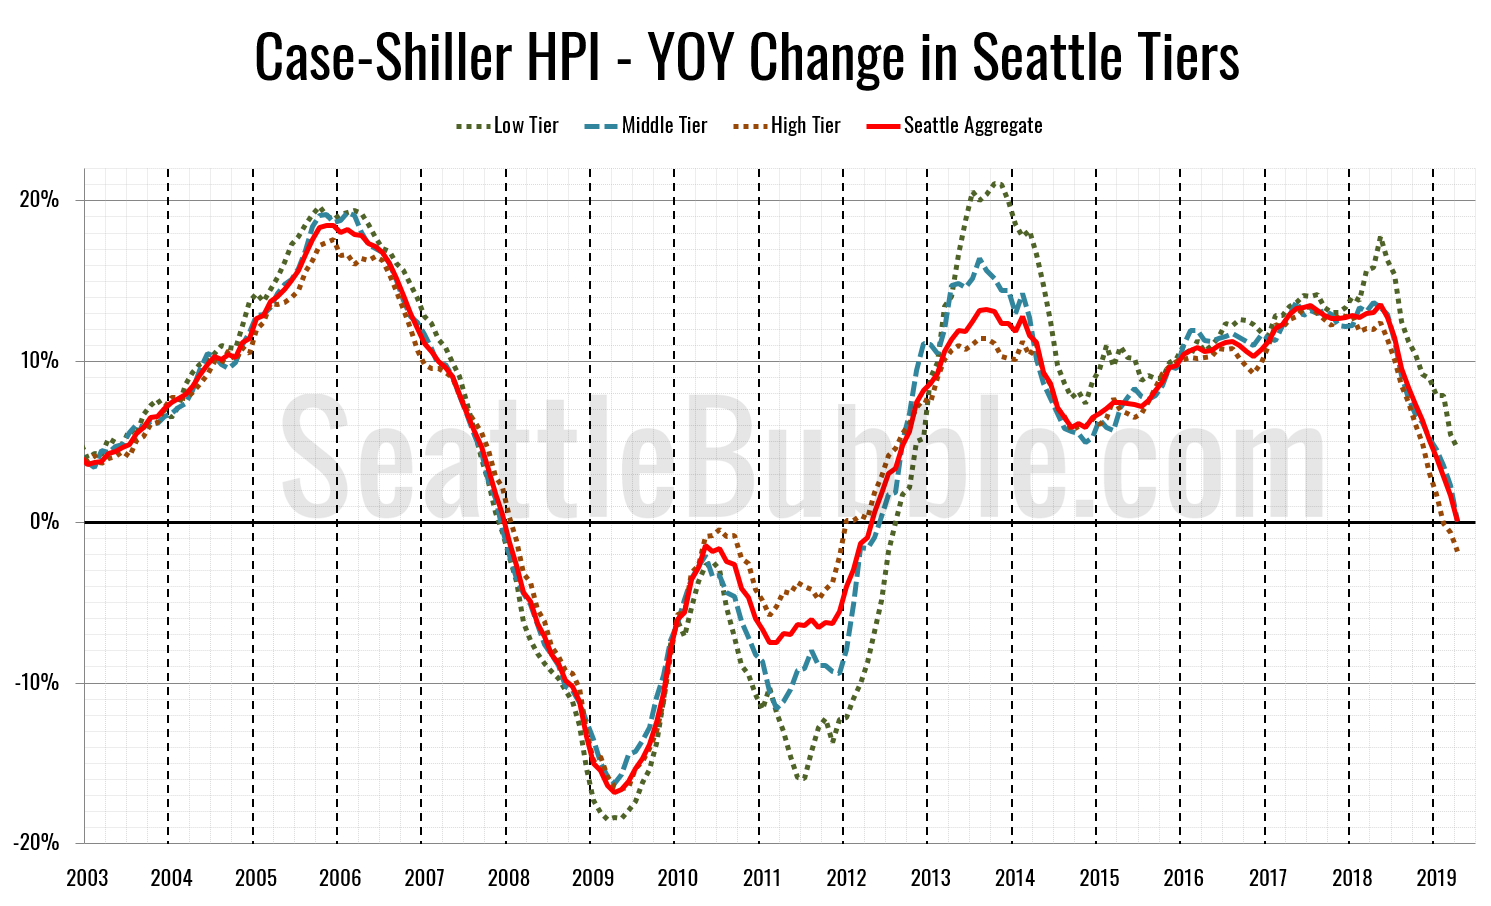
Year-over-year price growth is falling in all three tiers, with the high tier having flipped to year-over-year losses as of February.
Let’s check out the three price tiers for the Seattle area, as measured by Case-Shiller. Remember, Case-Shiller’s “Seattle” data is based on single-family home repeat sales in King, Pierce, and Snohomish counties.
Only the low tier was up month-over-month once more in July. The middle tier and high tier both fell…
Let’s check out the three price tiers for the Seattle area, as measured by Case-Shiller. Remember, Case-Shiller’s “Seattle” data is based on single-family home repeat sales in King, Pierce, and Snohomish counties.
Note that the tiers are determined by sale volume. In other words, 1/3 of all sales fall into each tier. For more details on the tier methodologies, hit the full methodology pdf. Here are the current tier breakpoints:
It is a little late for this but it’s been a few months so I wanted to make sure we posted the update on Case-Shiller’s three price tiers.
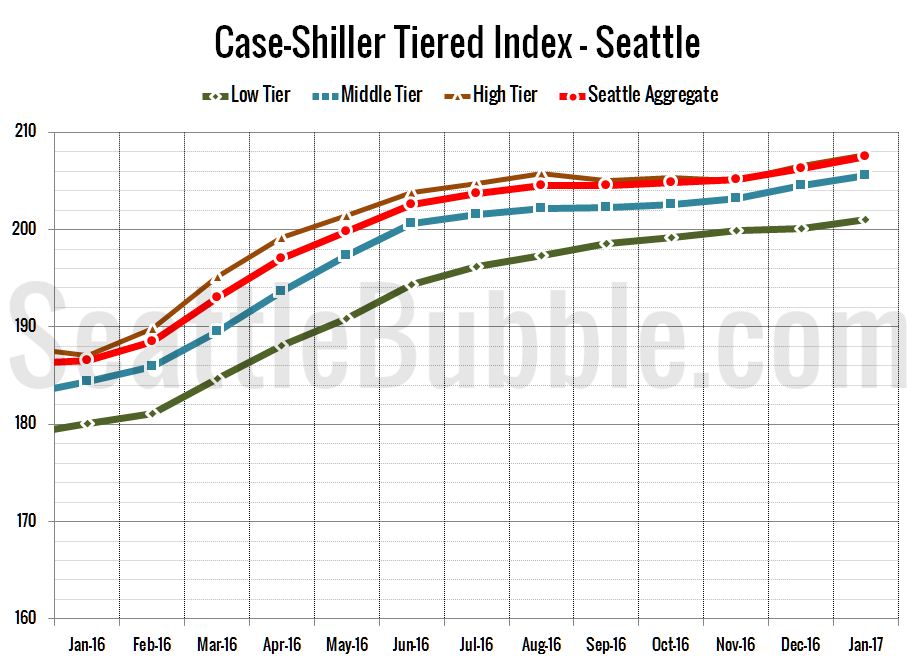
Let’s check out the three price tiers for the Seattle area, as measured by Case-Shiller. Remember, Case-Shiller’s “Seattle” data is based on single-family home repeat sales in King, Pierce, and Snohomish counties.
Note that the tiers are determined by sale volume. In other words, 1/3 of all sales fall into each tier. For more details on the tier methodologies, hit the full methodology pdf. Here are the current tier breakpoints:
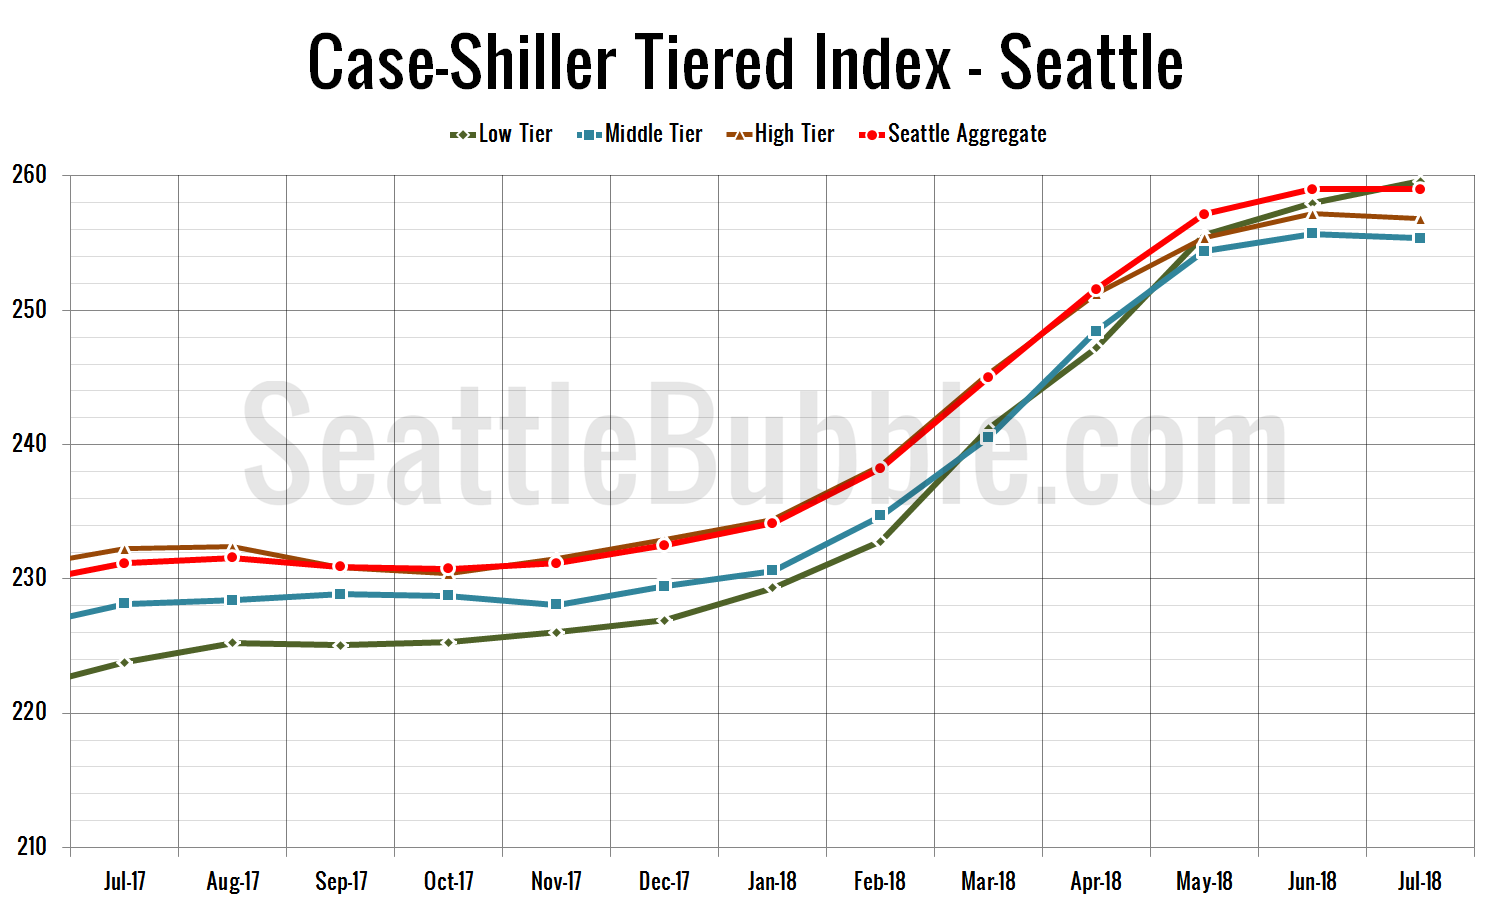
All three tiers are increasing month-over-month, and look to be setting up another year of big price increases.
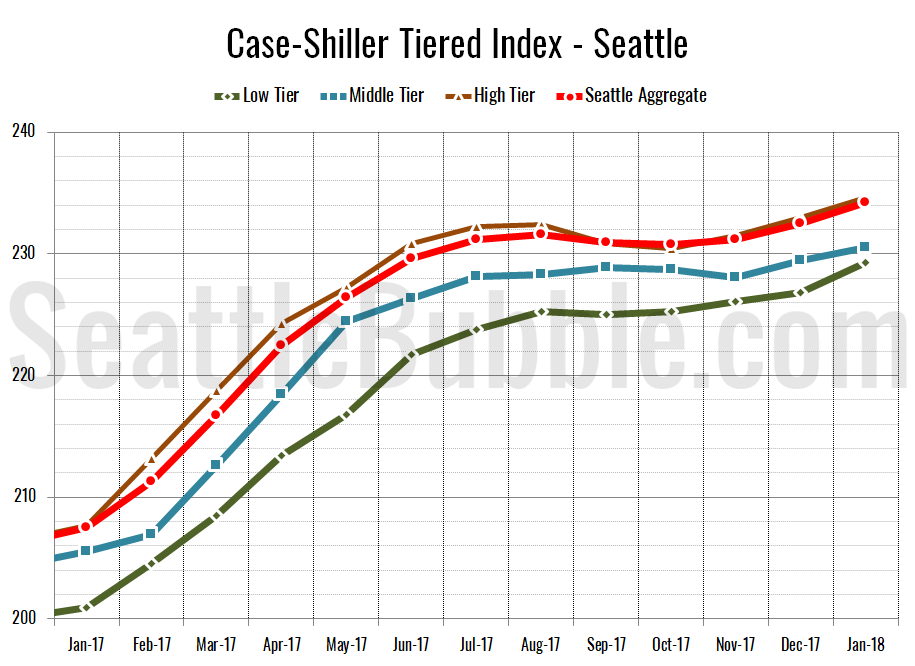
Between December and January, the low tier increased 0.5 percent, the middle tier rose 0.5 percent, and the high tier was up 0.5 percent. Somehow this translates to an overall increase of 0.6 percent.