Let’s have a look at the latest data from the Case-Shiller Home Price Index. According to September data,
Down 0.6% August to September.
Down 2.6% YOY.
Down 24.6% from the July 2007 peak
Last year prices fell 0.4% from August to September and year-over-year prices were down 13.8%.
The post government-meddling double-dip continues unabated. So far, prices have fallen 3% from their mini-peak here in Seattle last August, but are still 1.1% above their February 2010 low.
Here’s an interactive graph of all twenty Case-Shiller-tracked cities, courtesy of Tableau Software (check and un-check the boxes on the right):
Back in June, fifteen of the twenty Case-Shiller-tracked cities were in positive YOY territory. As of September, just five remain there: Los Angeles, San Diego, San Francisco, Washington DC, and Boston (barely).
In September, eleven of the twenty Case-Shiller-tracked cities experienced smaller year-over-year drops (or saw year-over-year increases):
- San Francisco at +5.5%
- San Diego at +5.0%
- Washington, DC at +4.5%
- Los Angeles at +4.4%
- Boston at +0.4%
- New York at -0.4%
- Minneapolis at -1.2%
- Denver at -1.6%
- Cleveland at -1.9%
- Phoenix at -1.9%
- Dallas at -2.6%
Falling faster than Seattle as of September: Miami, Atlanta, Detroit, Las Vegas, Portland, Charlotte, Tampa, and Chicago.
Hit the jump for the rest of our monthly Case-Shiller charts, including interactive charts of all 20 cities.
Here’s the interactive chart of the raw HPI for all twenty cities through September.
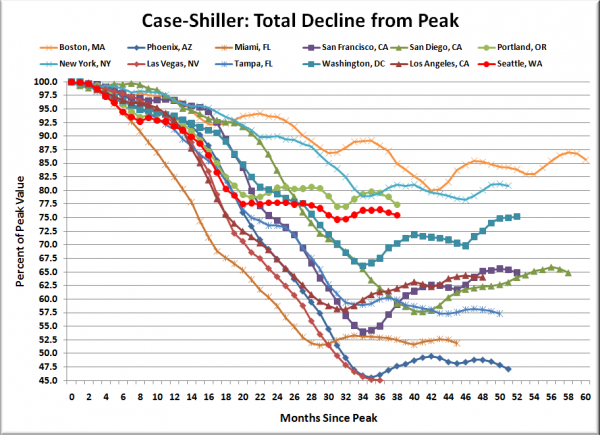
Here’s an update to the peak-decline graph, inspired by a graph created by reader CrystalBall. This chart takes the twelve cities whose peak index was greater than 175, and tracks how far they have fallen so far from their peak. The horizontal axis shows the total number of months since each individual city peaked.
In the thirty-eight months since the price peak in Seattle prices have declined 24.6%, slightly more than last month, but not quite matching the max drop seen so far, in February.
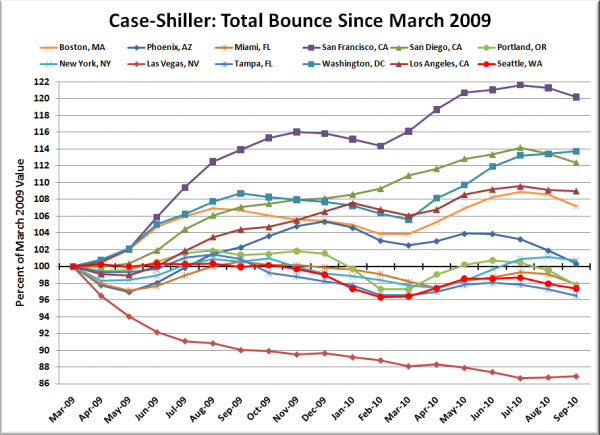
Here’s a complementary chart to that last one. This one shows the total change in the index since March 2009 for the same twelve markets as the peak decline chart.
Only three cities got less of a boost from the tax credit than Seattle: Charlotte, Tampa, and Las Vegas. For whatever reason, California seemed to be the biggest beneficiary of all that free money.
Obviously the massive injection of free cash from the government has screwed with the normal market cycles around the country, and almost completely eliminated the geographic lag effects that were visible in the data before 2009.
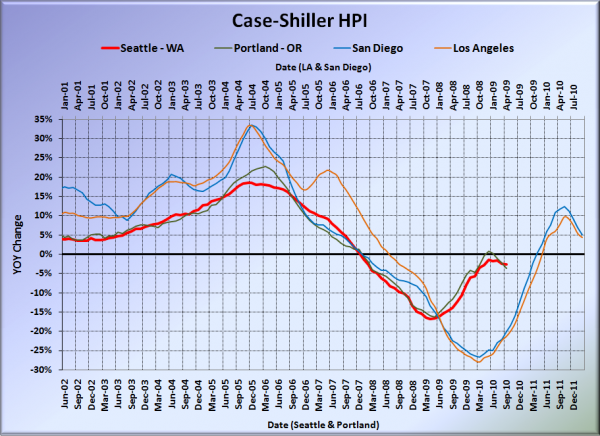
For posterity, here’s our offset graph—the same graph we post every month—with L.A. & San Diego time-shifted from Seattle & Portland by 17 months. All four cities continued to fall in September. Year-over-year, Portland came in at -3.6%, Los Angeles at +4.4%, and San Diego at +5.0%. Portland fell further than Seattle for the first time since November 2008.
Note: This graph is not intended to be predictive. It is for entertainment purposes only.
Check back tomorrow for a post on the Case-Shiller data for Seattle’s price tiers.
(Home Price Indices, Standard & Poor’s, 10.30.2010)
Very cool interactive charts. Great work Tim.
THE HOUSING PROBLEM IN 3 PICTURES
http://pragcap.com/housing-market-3-pictures
Next month I expect our home in Seattle’s Viewridge neighborhood – no water view – to be valued at what we paid for it in early 2005 (which, of course, means we’d have to sell it for a loss if it came to that). Disheartening,
I don’t know what others think, but I think it may be time to drop the offset graph. It has no use anymore in my opinion. Yes, it was interesting that the initial decline in prices in Seattle and Portland happened 17 months after Los Angeles and San Diego, but that correlation isn’t there anymore. The latest peak, and the dip just before that, happened around the same time in all four cities. Offsetting the So. Cal. cities from the NW cities by 17 months doesn’t provide anything of value anymore.
RE: Dave0 @ 4 – I’ve been saying the same thing in these threads for probably at least four months, to no effect.
Although the graph isn’t completely useless. It shows how foolish it is to take a simple idea and try to apply it to predict future real estate prices. :-D
I Like Tim’s 3RD Chart
It clearly defines how the deficit busting tax credit props real estate prices up for a few months, now it’s over and they’re plummetting down again.
RE: man in the middle @ 3 –
Actually, I’d say you’re approaching the break even point. For kicks I checked the mortgage rates for early ’05 and it appears that rates were between 5.5 and 6.0% at that time. I have no idea what you paid but I’ll use a 400k loan for an example. At year six (early ’11) you’ll have paid $37,234 in principal on the loan (5.5% 30 year fixed) or 9.3% of the loan. Assuming you could fetch the same price for the property you’d have obligations of 3% to the buyers agent, 3% to the sellers agent, 2% excise tax, and roughly 2% to pay for sellers closing costs or 10% total ($40,000). This assumes you use traditional routes to sell the home instead of Redfin or a cheaper route to sell. It doesn’t account maintenance on the house or property taxes paid, but doesn’t include mortgage tax breaks either. Assuming no appreciation/depreciation it appears 6-7 years is the sweet spot for building loan equity equal to pay off associated costs with selling a home. Considering that most people only stay in their homes an average of 7 years this system makes no sense to me (unless you’re a part of the real estate industry or the government.)
Note: I didn’t include down payment since I assume that coming out square includes getting back one’s down payment at the end. You could argue lost investment opportunity with the down payment money but that’s a separate issue. Feel free to pick apart at my reasoning.
Tim: please finish your sentence (start of the third paragraph).
“The post government-meddling double-dip continues unabated. So far, prices have fallen”
I want to know the pace since the credit expired.
RE: Cheap South @ 8 – Doh. Sorry, got lost there and didn’t come back. I finished the sentence that I originally was writing. In the 3 months since the last month of the credit (June), prices have fallen 1.2% in Seattle.
September’s CSI data includes sales from July, August and September. Just wait until those three months are November, December and January.
I’ll start the bidding at a 7% drop from now (September’s data) to March (when January data first appears). Do I hear 8%?
RE: LA Relo @ 10 – I’ll take 9% based on what I see here: http://www.housingtracker.net/asking-prices/seattle-washington/
It could be worse than that, but I’ll be prudent. Of course, pfft is stuck with his bottom call, so he won’t be predicting more declines. Hehe….
RE: The Tim @ 9 –
Thank you Tim.
I wonder if they’ll pick up to 1%/month for the last trimester of the year.
OK, I just read LA Relo and Ben’s posts. Ouch.
By Timmcb @ 7:
You’re assuming that C-S numbers mean something to an individual homeowner. They don’t.
Part of the reason that California might have had a bigger bounce is that they actually had a state credit for an additional $10,000 for first time homebuyers — 100 million in state funding to add to the federal tax credit .
By Kary L. Krismer @ 5:
I like the graph, but it would still be interesting to show the same graph, just without the shift.
By Dave0 @ 4:
I disagree. The offset clearly demonstrates how Seattle began its necessary correction before government interference into the market temporarily held up the correction. According to the chart, the government intervention is waning, and the necessary correction has resumed.
Yes, a chart of all timelines lined up would be nice too. :)
By Kary L. Krismer @ 5:
IMO, it shows how foolish you were to not use this technique prior to buying your house at the peak in 2007. As you can see, buy the time you bought your house, prices had already been dropping into the sewer in CA. Had you had good data analysis skills, you could have saved yourself hundreds of thousands of dollars like I have. :-D
RE: Jonness @ 17 –
Maybe that’s why he doesn’t like the offset graph. Personally, I like it. I think CA can/may be predictive in some situations, including housing trends. And I love making predictions.
By Scotsman @ 18:
Just like Kary!
I think Pft and the realtor shills are right. We bottomed a long time ago. Buy now or forever…
(sarcasm off)
By Jonness @ 17:
You’re greatly overstating the drop in my house value, which in any case is probably roughly equal to the drop in value of our prior house had we kept it. But to each his own. I have zero interest in renting. To me the foolish are those here saying they didn’t buy in 2005 and have rented since, when they would have basically just broken even at this point, depending on the property of course. To have the uncertainty of renting, and possible frequent moves as reported by some here, simply is unacceptable to me.
Rather than focus though on what the price was in 2005 vs. 2010 though, I would say that 2005 might not have been a good time to buy because it would have been much harder to get an offer accepted on a good house then. That would have been more likely to have kept me from buying then, rather than the price. It was hard enough to find a place in late 2007 when the market had already started to slow.
By HappyRenter @ 15:
That’s exactly what the second Tableau chart is, but with the added ability to turn on all the other markets too if you want, and to adjust the time scale.
RE: Kary L. Krismer @ 13 –
No I was just responding to what he felt (feels?) about the value of his property.
“Next month I expect our home in Seattle’s Viewridge neighborhood – no water view – to be valued at what we paid for it in early 2005 (which, of course, means we’d have to sell it for a loss if it came to that). Disheartening,”
Kary
Why do you spend so much time here? are you thinking that many of the People here are prospective customers? After-All probably the Hardest thing at the Moment is getting the customer if your a Real Estate agent right?
Would You classify yourself as listing or selling agent?- or just about anything that makes a dollar at the moment?
My 2 cents, “I do not agree with you at all about PRICES.. I believe that 2005 prices will end up getting blown though and the stopping point could end up around 2000 prices.
There is still a lot of Clouds on the Global Economy… It does seem on some fronts things are getting better, however housing is something that especially for Seattle is still a ways off. I’ve been in the housing bust camp since 2003-2004
By Ron Nelson @ 24:
Hardly. The last person who called me from this site I referred to Craig Blackmon because he was a better fit. I’m here because it’s actually a pretty good source of information (and it doesn’t take that much time really).
As to the last comment, I don’t know how it is you can disagree with me about prices when I haven’t taken a position on future prices. ;-)