Up<\/strong> 2.7 percent March to April
\nUp<\/strong> 13.1 percent year-over-year.
\nUp<\/strong> 30.8 percent from the July 2007 peak<\/p><\/blockquote>\nOver the same period last year prices were up 2.6 percent month-over-month and year-over-year prices were up 12.9 percent.<\/p>\n
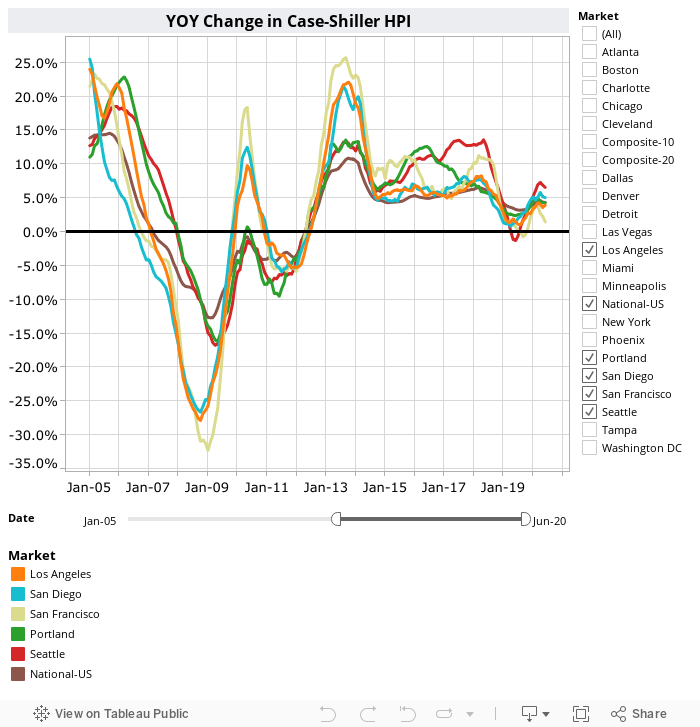
Seattle still leads the nation in both year-over-year and month-over-month home price growth. Seattle has had the highest year-over-year price growth since September 2016. The only other metro areas with double-digit price growth from a year earlier in April were Las Vegas at 12.7 percent and San Francisco at 10.9 percent.<\/p>\n