RCG vs. SB Stats

Whenever Dustin posts stats over at Rain City Guide, I can't help but compare them to the same stats for Seattle Bubble.
Here's his most recent offering:
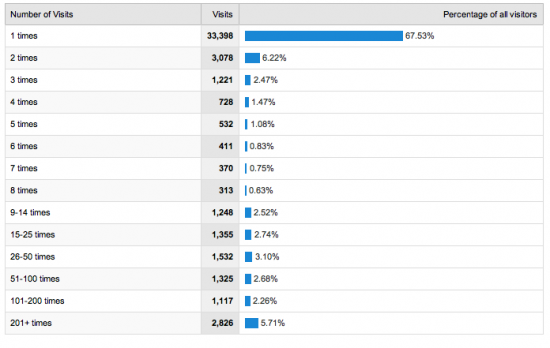
Adding up the totals for each category shows a total of 49,454 visitors for February. He also specifically points out the 2,826 people that visited RCG more than 200 times. Impressive, for sure.
Here's the same Google Analytics page for Seattle Bubble in February:
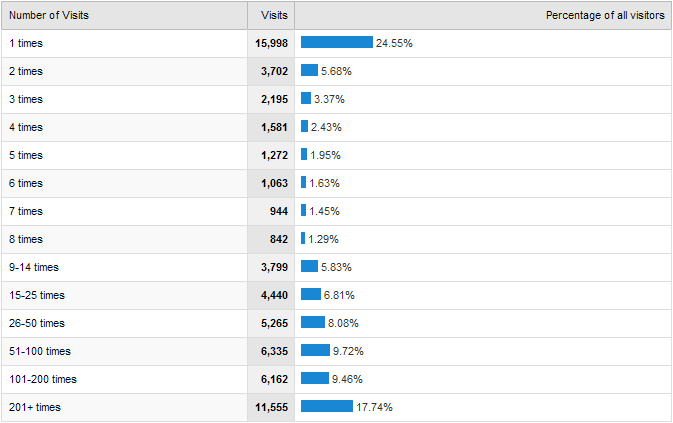
Our February total was 65,153 visitors. We had 11,555 people that visited over 200 times in February.
Wow, people.
Here's his most recent offering:
Adding up the totals for each category shows a total of 49,454 visitors for February. He also specifically points out the 2,826 people that visited RCG more than 200 times. Impressive, for sure.
Here's the same Google Analytics page for Seattle Bubble in February:
Our February total was 65,153 visitors. We had 11,555 people that visited over 200 times in February.
Wow, people.
Comments
I promote your site in the classroom all the time!
Interesting... What kind of feedback do you hear from the students? Do they think we bubble-heads are off our rocker?
I have a tendency to load a page + comments and skim through it over the course of about an hour. Does the next page load represent visit 2?
Very few Realtor and mortgage broker students of mine have ever heard of seattlebubble let alone raincityguide and even sites like calculatedrisk. I taught a class on foreclosures this morning, about 25 Realtor students, and only one of them had read these blogs. This is typical. I drew out the mortgage meltdown diagram on the board showing the systemic path from the consumer, the mtg broker, the wholesale lender, the investment banker, the monolines, ratings agencies, and so forth, and very few were aware of the extent of the crisis.
Which never ceases to astonish me.
I was talking with a people in my company a couple months ago who are specifically assigned to work with the structured credit industry, and was very surprised to find out how little they understood about how the various parties (e.g. monolines, ratings firms, etc) interacted to make these products possible. Even more astonishing, my colleagues were under the impression that there was just a minor hiccup happening since the hedge funds managers, and investment bankers they hang out with have been telling them the CDO market will be back in good health in a month or so (and this was back in early January).
It almost seems as if the people who are most intimately involved with the financial industry are the least aware of the true scope of what is happening, and why.
Maybe it's the old adage that a doctor or lawyer who serves herself has a fool for a patient/client.
Maybe that's because most of the ones that do read these blogs have already left the industry!
If you have this diagram in digital format, I think it would be appropriate to post it here. A lot of the people on this site have a good idea to just how contagious things are, but picto-graphs are beneficial too.
Why is that? Realtors are home salespeople not real estate experts.
Rain City Guide January: 59,700 visits, 93,400 page views
Seattle Bubble January: 87,250 visits, 215,833 page views
I checked compete.com for comparison seems to be correct at least from their judgement.
I do know from previous stats Dustin has posted (including the one at the top of this thread) that while RCG doesn't get as many overall hits as Seattle Bubble, they do get more actual unique individual people visiting the site in a given month, because the vast majority of their visits are "drive-by" visitors that drop in a single time and never return, whereas on Seattle Bubble that only makes up about 1/4 of our traffic.
Compete.com is pretty useless on smaller niche sites like RCG and Seattle Bubble. They don't have tracking code on our sites, and their #s are basically just a wild guess.
Note that Ardell's "bottom call" has really upped traffic at RCG
Traffic at both sites has bumped up quite a bit since mid January. I think its mostly due to the seasonal nature of the real estate market.
Also note the "Monthly Visits per Person" chart:
RCG: 1.4
SB: 4.5
Rain City gets more drive-by traffic, Seattle Bubble gets more overall traffic. Whatever the reason, we seem to have more engaging content that keeps people coming back for more.
Ardell just had a weekend of bottom-calling. I'm going to up the ante and bring down an entire week of bottom-calling!
Seattle-area traffic as a % of the whole:
RCG: 31.3%
SB: 74.4%
Web stats are weird.
It was a set up. She created traffic to coincide with her press release of the post.
Not meant to be a slam on my man Tim - just sayin'. Google is not really good at sharing the wealth...
DJ, there are a lot of blogs that are high up in Digg and other social networks that concentrate on revenue, and I have seen people with six figures on blogspot hosted blogs even. It does take about 40k hits a day though. Not 1k.
Let me be more specific then, based on an ad policy like this one, no one is getting rich on ads off of RCG. Four 160 x 60 placements @ $200 a month! (that's a $2 CPM by the way.) Tim is an absolute sell-out based on that comparison!
I am aware that there are a few highly successful bloggers - but in general I believe the blogoshpere is like the real estate business where a few agents rake in the coin and everyone else splits the crumbs.
Only instead of a dog, it would be a pink pony (obviously).
Just saying.