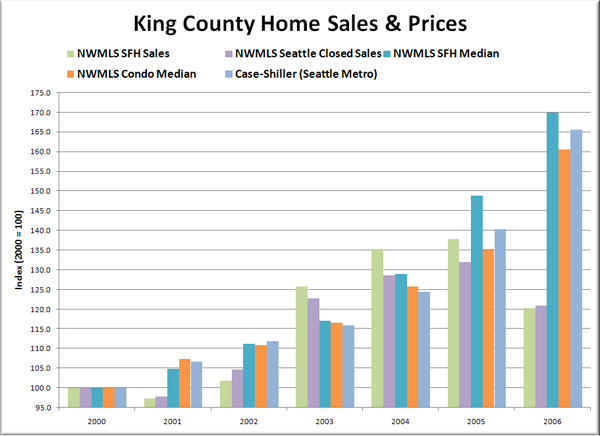
This is a little redundant, but that’s why I’m posting it on a Saturday. It’s just a slightly different take on the economic fundamentals that allegedly drive the local housing market. Much of this data comes from the recently-released 2007 King County Annual Growth Report. You can get all these charts and the data behind them in this spreadsheet.
Here’s a chart of local economic fundamentals from 2000 through 2006:
And here—on the same scale—are some measures of the local housing market for the same time period:
Here are the fundamentals and the housing market measures all on the same chart.
I realize that posts like this are seen by some as beating a dead horse. The sad thing is that there are still people that believe that home prices are somehow supported by these fundamentals. I wonder if someone that believes this could be bothered to bring out the data that supports such a position.
(King County, 2007 Annual Growth Report, 2007)


