Home prices in Seattle edged down again to within an inch of zero year-over-year change, according to the latest data from the Case-Shiller Home Price Index.
Down 1.21% November to December.
Up 0.49% YOY.
For those of you keeping score at home, that makes five month-to-month declines in a row. Seattle has now declined a total of 3.86% from its July 2007 peak. More on that below.
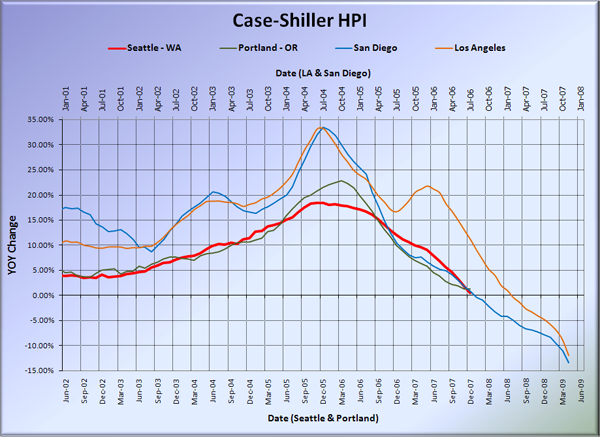
Here’s the usual graph, with L.A. & San Diego offset from Seattle & Portland by 17 months. You’ll notice that Seattle’s YOY performance slipped below Portland for the first time
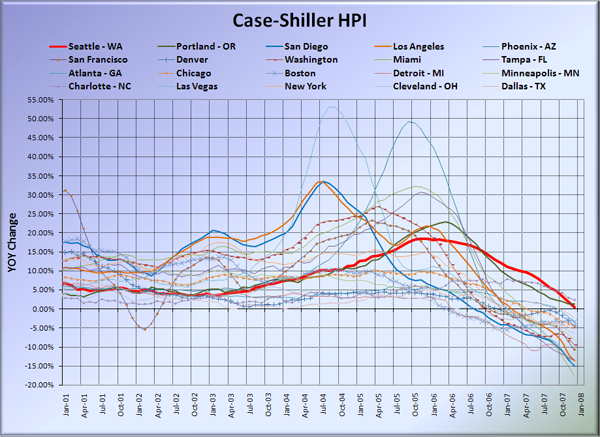
And here’s the graph of all twenty Case-Shiller-tracked cities:
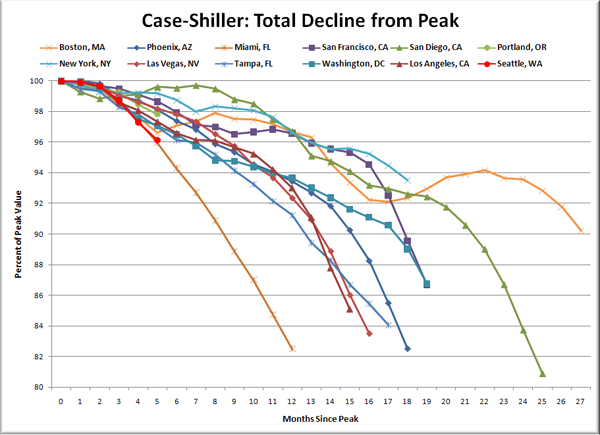
Lastly, here’s a new one for you. The concept is inspired by a reader who has posted a similar graph a couple of times. I don’t recall who specifically, so I apologize for not giving you explicit credit here. This chart takes the twelve cities whose peak index was greater than 175, and tracks how far they have fallen so far from their peak. The horizontal axis shows total months since each individual city peaked. The peaks ranged from September 2005 (Boston) to July 2007 (Portland & Seattle), so that explains why each line is a different length.
Seattle may have been late to the party, but in the six months since our market peaked, it seems to be doing its best to catch up quickly.
(Home Price Indices, Standard & Poor’s, 02.26.2008)


