Here’s our monthly look at Seattle’s price tiers from Case-Shiller. I’d like to start by answering a few questions about these tiers that came up last month. First, all Case-Shiller data is based on single-family homes only, no condos or townhomes. Also, the Case-Shiller definition of the “Seattle area” is King, Pierce, and Snohomish counties. Lastly, some people were wondering how the tiers are chosen. Here is the explanation from the Case-Shiller methodology pdf:
The Division of Repeat Sales Pairs into Price Tiers
For the purpose of constructing the three tier indices, price breakpoints between low-tier and middle-tier properties and price breakpoints between middle-tier and upper-tier properties are computed using all sales for each period, so that there are the same number of sales, after accounting for exclusions, in each of the three tiers. The breakpoints are smoothed through time to eliminate seasonal and other transient variation. Each repeat sale pair is then allocated to one of the three tiers depending on first sale price, resulting in a repeat sales pairs data set divided into thirds.
Now let’s move on to the graphs. First up is the straight graph of the index from January 2000 through January 2008.

While the performance of the three tiers has diverged somewhat since 2004, prices in all three tiers have retreated back to approximately August 2006.
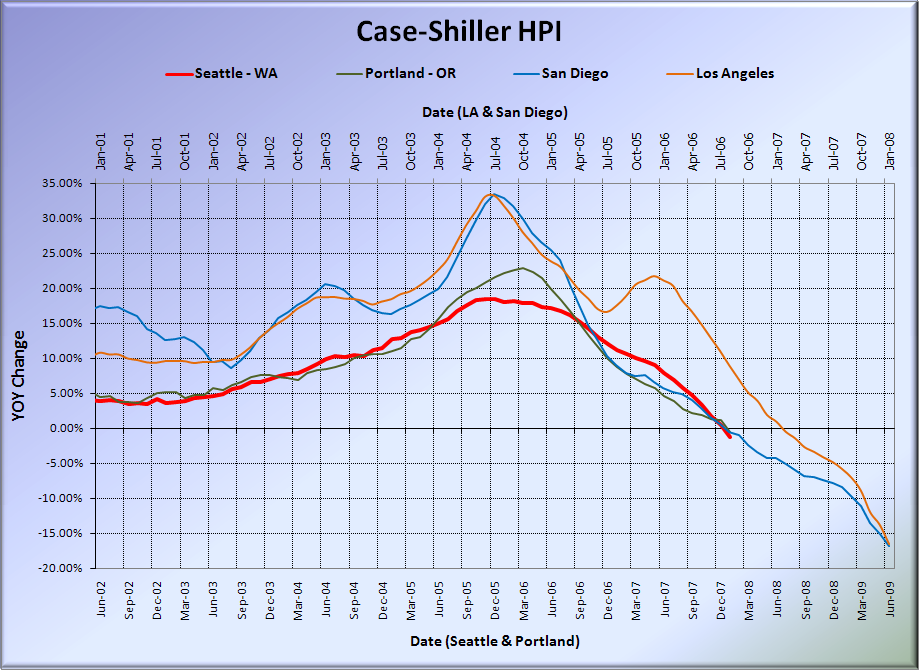
Here’s a chart of the year-over-year change in the index from June 2002 through January 2008 (I selected that date range to match the time-shifted graph in the standard Case-Shiller posts).

Only the high tier has yet to dive into year-over-year negative territory. Both the low and the middle tier sit at over 2% negative.
Lastly, here’s a decline-from-peak graph like the one posted yesterday, but looking only at the Seattle tiers.

Wow, the high tier really took a tumble last month, making up pretty much all the ground it had lost to the other two tiers. Now all three tiers sit at around 6% below their peaks.
So even though prices in the high tier rose the slowest and peaked the latest, right now they’re falling the fastest. It will be interesting to see if this trend continues as things unwind.
(Home Price Indices, Standard & Poor’s, 03.25.2008)