The affordability index is something we have visited multiple times in the past on these pages. If the concept is new to you, or you just feel like a quick refresher, I recommend you check out the following posts:
- Seattle Soft Landing: Do The Math
- A Question Of Affordability
- Revisiting Seattle’s Soft Landing
- King County Affordability: 1950-2007
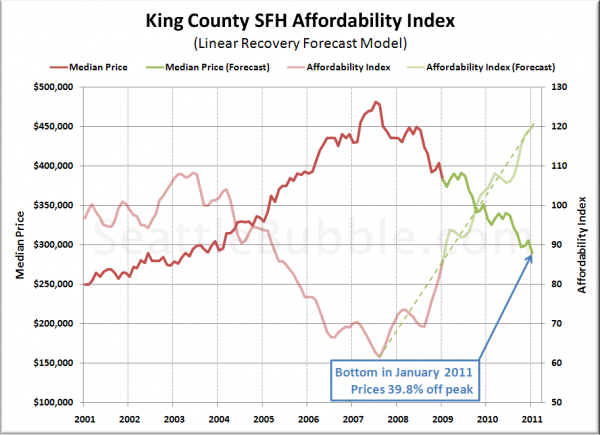
Today’s bottom-calling forecast is based on the premise that the affordability index for King County will return to its previous level.
Here are our basic assumptions for the Affordability Index forecast:
- The baseline affordability index is 109.6 (1985-1999 average).
- Price corrections will overshoot by 10% on the way back down.
- Therefore, the target affordability index is 120.6.
- Affordability will continue to recover at roughly the same rate it has since bottoming out in August 2007.
- Over the next few years:
- Interest rates will hold roughly steady at ~5%.
- Incomes will be more or less flat.
Given these assumptions, here’s a rough picture of what King County’s median single-family home price would look like through early 2011:
Using the Affordability Index forecast model, Seattle-area home prices (as measured by the NWMLS King County SFH median) will hit bottom sometime around early 2011, giving up just under 40% of their peak values.
This prediction is suprisingly similar to yesterday’s Simple Mirror Forecast, arriving at the same month for a bottom, with prices differing by less than five percentage points.
As I stated in the post A Question Of Affordability, I believe that in order to see affordability shift to a ‘new plateau,” there must be a fundamental shift in the desirability of an area relative to other cities across the country, such as was seen between the ’70s and ’80s in Seattle.
The Seattle area last saw affordability in the 100-110 range as recently as 2003. Has the area really become considerably more desirable since then? If the answer is no, then I predict that this forecast has a pretty good chance of coming true.
Method 4: Affordability Index Forecast (Summary)
Bottom Month: January 2011
Bottom Value: 39.8% off peak
Likelihood*: 20%
* Likelihood is a totally subjective value assigned according to The Tim’s gut feeling. Treat it accordingly.
Bottom-Calling Week on Seattle Bubble
- Introduction: Bottom-Calling Week on Seattle Bubble
- Method 0: Blind Optimism
- Method 1: Inventory-Based Forecast
- Method 2: Dollars per Square Foot Linear Forecast
- Method 3: Simple Mirror Forecast
- Method 4: Affordability Index Forecast
- Method 5: San Diego Lag Forecast
- Conclusion: So Where’s the Bottom?
