Now that 2009 Q1 + 1 month is in the past, let’s have an updated look at the relationship between pending and closed sales. For previous posts on this subject, hit the ‘pending’ tag archive.
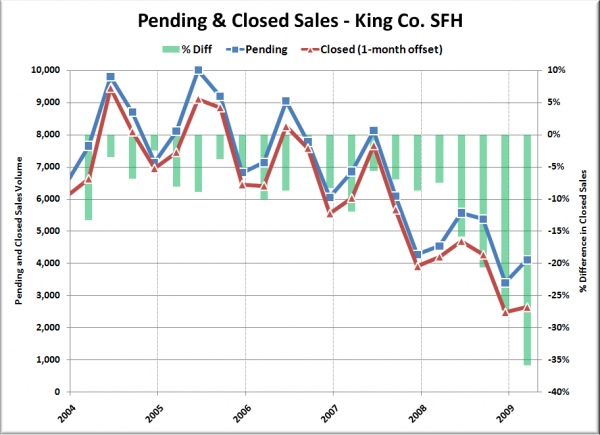
Below is the updated chart including 2009 Q1. It shows quarterly King County SFH pending sales volume from the NWMLS, with closed sales offset by one month (since closings should theoretically take ~30 days). In other words, the pending sales data for Q1 includes January, February, and March, while the closed data is for February, March, and April. The blue and red lines represent pending and closed sales (left axis), while the green bars represent the percent difference between closed sales and pending sales (right axis).
The 2000-2007 average difference between pending and closed sales for the first quarter was just 8.8%. In 2008, the difference per quarter was 7.5%, 15.9%, 20.7%, and 27.3%. In the first quarter 2009, the gap between the two widened for the fourth quarter in a row, to yet another new record of 35.9%.
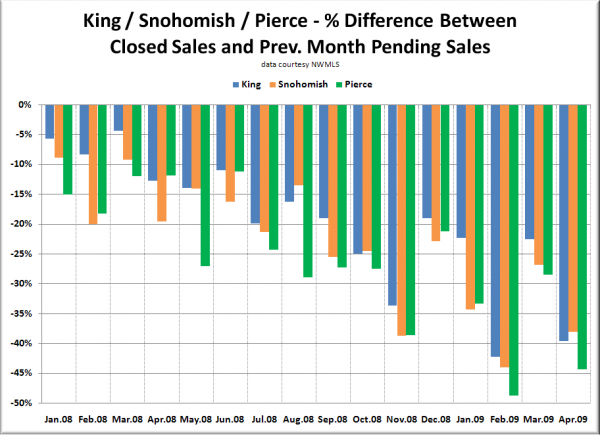
Here’s a look at the month-to-month data for all sales (SFH and condos) in King, Snohomish, and Pierce back through the beginning of 2008:
There are two theories as to why this gap is becoming so large, both centered on short sales.
The first theory is that the “pending sales” statistic in the NWMLS end-of-month reports includes all sales that were in “pending” status as of the last day of the month, rather than counting all sales that changed from “active” to “pending” in the given month. This would cause short sales, which typically take longer than 30 days to close, to be counted as a “pending sale” for multiple months, thereby artificially inflating the pending sales data.
The second theory is that the number of short sales as a percentage of total sales is rapidly increasing every month, and therefore more and more closings each month are being delayed beyond the “normal” 30-day period.
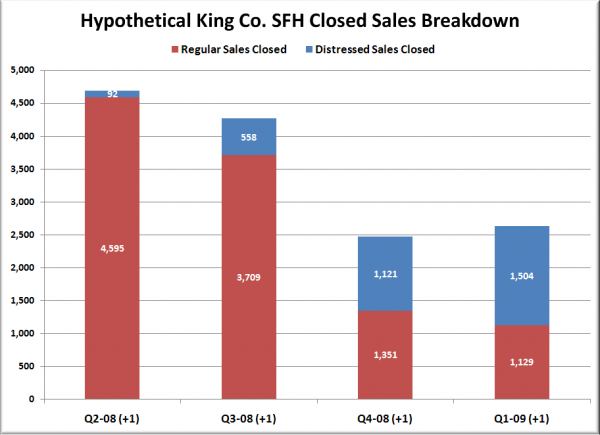
In the chart below, I have attempted to visualize the second theory, based on the following:
- Fact: the average failure rate 2000-2007 was 5%
- Assumption: the excess apparent failed sales above 5% represent distressed sales
- Assumption: distressed sales will fail at quadruple the normal rate (20%)
- Assumption: distressed sales average 90 days to close
Here’s how King County’s SFH quarterly closed sales would break down over the last four quarters (with each quarter offset +1 month), given the above fact and assumptions:
Interestingly, the 4-quarter total percentage of distressed sales calculated using the above assumptions comes out to 23%, which is fairly close to the number of foreclosure + short sale transactions reported by Zillow over the last year in the Seattle area. Their national spreadsheet says that 13.9% of the transactions in the Seattle-Tacoma-Bellevue area in the last 12 months were foreclosures, and 12.3% were short sales, for a total distressed sale percentage of 26.2%.
We still have not heard a definitive answer on the way that the NWMLS counts their end-of-month “pending sales” data, so we can’t rule out theory #1 entirely. But either way, the story here appears to be that a large number of short sales in the Seattle area are skewing the formerly-reliable pending sales statistic, making it increasingly difficult to get a true handle on what home-buying demand really looks like.


