Rich Toscano posted a great breakdown of the job situation down in San Diego yesterday that I thought was an interesting way to look at the data, so I’m shamelessly and blatantly copying it.
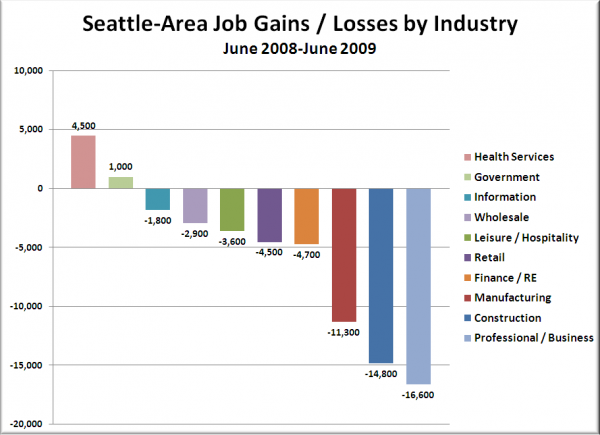
The following chart shows the volume of job gains or losses in the last 12 months in some of the largest Seattle-area industries:
Manufacturing, construction, and professional / business services were by far the hardest hit in sheer volume, losing a total of 42,700 jobs between the three sectors.
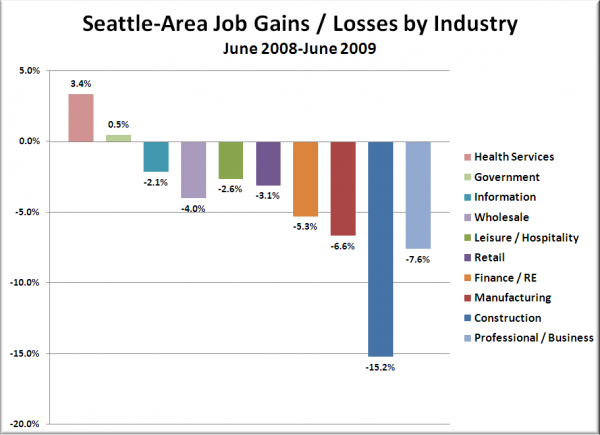
Here’s a look at the same data, broken down by the year-over-year percentage change, to give a better picture of the relative health of various industries:
Relative to its size, construction has shed twice as many jobs as any other sector, while finance / real estate, manufacturing, and professional / business services all also lost over 5%. Apparently if you’re looking for a job in health services, you have a much better chance than most any other industry in the last year.
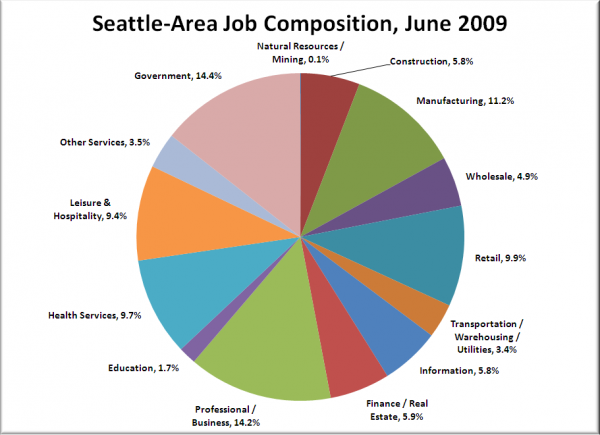
Finally, here’s a big pie chart showing all major industries that make up Seattle’s job market, to give you an idea which sectors have the largest effect on the total employment picture:


