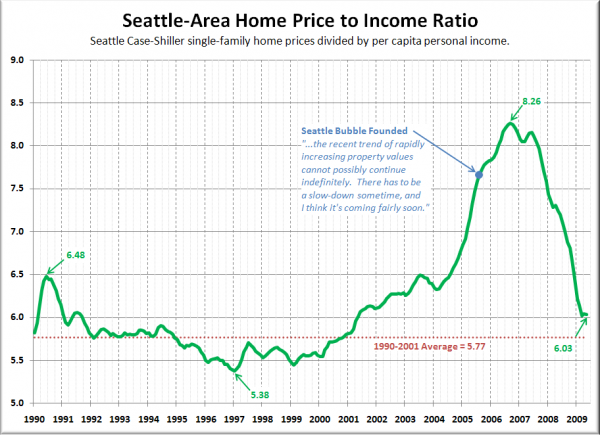
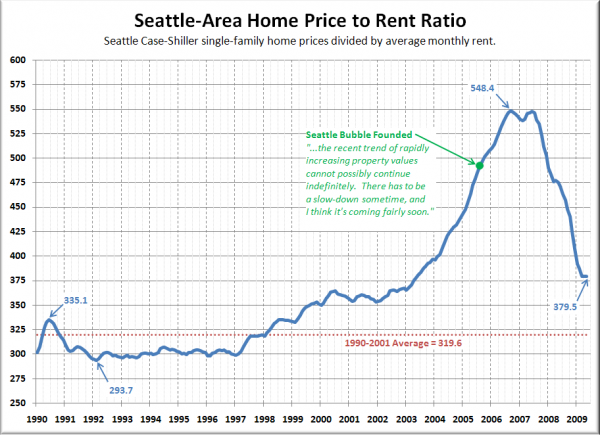
 Here’s an update to the area-wide price-to-income and price-to-rent ratio charts we first posted back in April.
These charts are based on per capita income, “Median Contract Rent” (from 2005 adjusted using the “rent of primary residence” component of the CPI), and Case-Shiller home prices indexed to the county-wide median. They are not intended to be used as a valuation tool for any specific home or neighborhood, but rather as a broad measure of the local housing market as a whole.
First up, the home price to income ratio:
There has been a little bit of improvement since our last update, with the ratio falling another 0.19 points (3%). As of May (the latest Case-Shiller data presently available) the price to income ratio sits roughly 5% above the 1990-2001 average (an improvement from 8% in January).
Here’s the home price to rent ratio:
Improvement on that front as well, with the ratio dropping 12.7 points (3%) since the April update. The price to rent ratio is still 19% above its 1990-2001 average (an improvement from 23% in January).
Since incomes and rents are currently falling along with prices, neither ratio has improved as much as we might expect. In the five months between January and May this year, Seattle-area home prices fell 3.5%, but since income also fell 0.6% and rents dropped slightly as well (0.3%), neither ratio has fallen quite as much as the raw drop in home prices.
The mini-plateaus over the last few months in both of the above charts closely resemble the same spring “bounce” that was seen last year. Following last year’s spring plateau from May to December, the price to rent ratio fell 14%, while the the price to income ratio fell 11%. It will be interesting to see where each ratio sits at the end of this year.

