Please consider the following excerpt from a post I wrote that was originally published on the personal finance blog Get Rich Slowly (and later here):
…if home buying is like a savings plan, it’s probably the worst savings plan on Earth. Would you voluntarily sign up for a savings plan where well over half of the money you deposit in the first 20 years simply vanishes, and from which you can only withdraw money by relocating and paying a 6-9% fee (not on the amount you have “saved” mind you, but on the total sale price of the home)? Of course not. That doesn’t sound anything like a savings plan.
If your goal is to build wealth, you will be much better off investing your money in the stock market than buying a home.
In the post, I described a pair of examples using real-world homes that I had located on both the rental and for sale markets at the time: comparable 3-bed, 2.5-bath, 1,800 sqft houses in nearby neighborhoods in the Kirkland / Juanita area. The rental was $1,495 a month, and the home for sale had an asking price of $425,000.
It just so happens that I wrote this post in July 2007, the peak month for Seattle home prices according to both the Case-Shiller home price index and the NWMLS King County SFH median. As such, I thought it might be instructive to run a little comparison of how things would have turned out for the hypothetical buyer and renter / stock investor described in the original post. With home prices off over 20% from their peak, and stocks down 34%, who would currently have more equity?
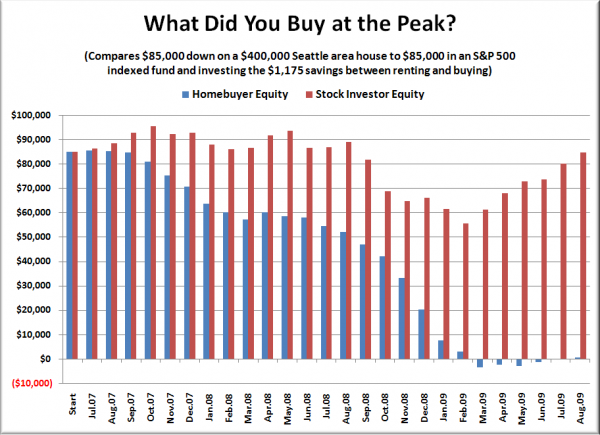
Following is a chart that shows the monthly equity in each scenario. Note that the buyer adds to their equity by paying $322-$367 in principal each month (it increases slightly each month), while the renter / stock investor increases their equity by adding the $1,161-$964 (it decreases slightly due to rent increases) they are saving each month to their investment. The value of the home is based on Seattle’s Case-Shiller index, with a slight increase in value assumed for July and August. The value of the stock investment is based on the S&P 500 index, and rent increases are based on the “rent of primary residence” portion of the CPI for the Seattle area.
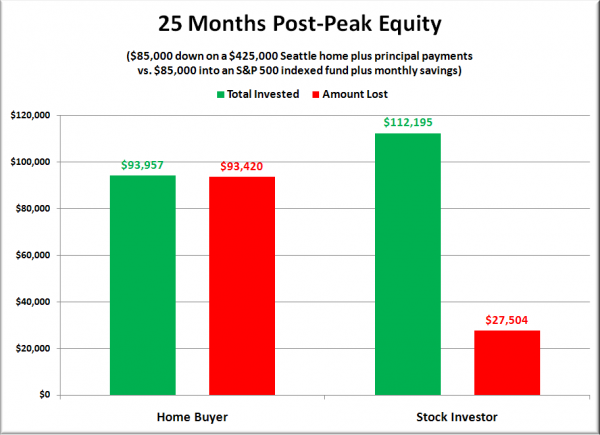
As of the end of August, just over two years into their respective “investments,” our hypothetical homebuyer is left with $537, while the renter / stock investor currently has $84,690 in equity. Here’s a visual of the total amount of money each would have put into their respective investments, and the total amount they have lost in the crash:
At 25%, the stock investor’s loss is nothing to sneeze at for sure, but it pales in comparison to the 99% loss suffered by the peak homebuyer. Ouch.
But what if we tweak the scenario slightly, in order to stack the deck as much as we can against the renter / stock buyer? Let’s say we set the start date to October 2007, the peak of the stock market, and only run the numbers through February 2009, the low point when stocks were over 50% off their peak. The stock buyer’s losses double to 50%, but as it turns out, the home buyer is still far worse off with a 93% loss.
Of course, the $85,000 down scenario isn’t really very realistic compared to what most people were really doing in 2007. Let’s modify the situation a bit into something more reflective of reality.
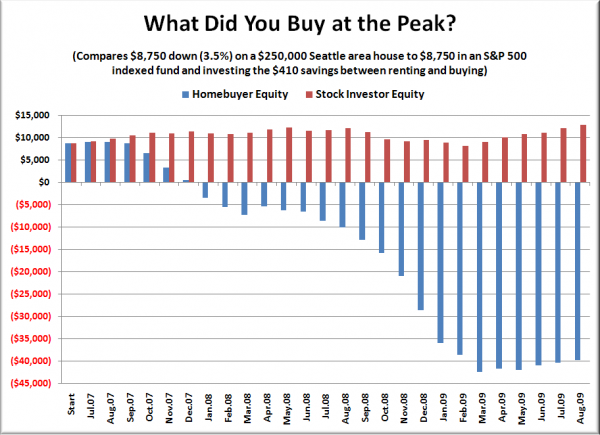
Instead of comparing 20% down on a $425,000 house, let’s say the hypothetical potential buyer and renter had just $8,750, which would be a 3.5% down payment on a $250,000 house. Again, to stack the deck against the renter / stock buyer in this scenario, we’ll assume they’re still paying $1,495 a month in rent, even though that would rent a far nicer house in 2007 than $250k would buy.
Here’s the equity matchup for our more realistic scenario:
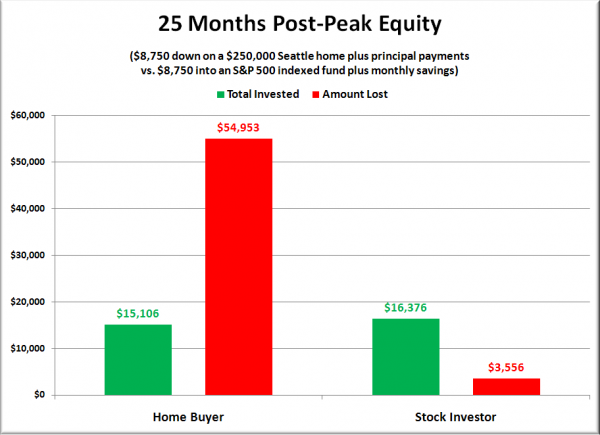
Wow. The homebuyer in this scenario presently has negative $39,847 in equity, while the stock buyer has $12,820. Take a look at the invested / lost chart:
The homebuyer has lost 364% of what they have put in, vs. 22% for the stock buyer.
I think this is an appropriate time to repeat the point I quoted at the beginning of this post. If home buying is like a savings plan, it’s probably the worst savings plan on Earth.
When you actually look at the present equity situation for the people who jumped into the housing market near the peak, stretching their budgets to buy a house that they didn’t even intend to live in long-term, the current record foreclosures start to make some sense.
If you bought a house near the peak thinking that it would be a great “forced savings plan,” you would probably be pretty tempted to hand over the keys, walk away, get yourself into a nice affordable rental, and get yourself started on an actual savings plan—like actually saving money every month. And who could blame you, really.
P.S. – I should add that at this particular moment, I don’t think the stock market is a very good place to put your money. With a P/E ratio on the S&P 500 somewhere in the ballpark of 150, I think stocks are primed to drop back down in the not-too-distant future, possibly by a considerable amount. That’s not investment advice, just my personal opinion.


