Let’s check in again on the cheapest homes around Seattle proper. Here’s our methodology: I search the listings for the cheapest homes currently on the market, excluding short sales, in the city of Seattle proper. Any properties that are in obvious states of extreme disrepair based on listing photos and descriptions will be excluded. This includes any listing that uses the phrases “fixer,” “rehab loan,” or “value in land.” I post the top (bottom) three, along with some overall stats on the low end of the market.
Please note: These posts should not be construed to be an advertisement or endorsement of any specific home for sale. We are merely taking a brief snapshot of the market at a given time. Also, just because a home makes it onto the “cheapest” list, that does not indicate that it is a good value.
Here are this month’s three cheapest single-family homes in the city limits of Seattle (according to Redfin):
| Address | Price | Beds | Baths | SqFt | Lot Size | Neighborhood | $ / SqFt | Notes |
|---|---|---|---|---|---|---|---|---|
| 5357 S Creston St | $82,900 | 3 | 2 | 2,020 | 6,450 sqft | Rainier Beach | $41 | bank owned |
| 3823 17th Ave SW | $112,000 | 1 | 1 | 560 | 1,594 sqft | North-Delridge | $200 | bank owned |
| 7916 14 Ave SW | $112,000 | 2 | 1 | 720 | 4,000 sqft | Highland Park | $156 | bank owned |
The home that had been hanging on in the top three, 522 S Concord, finally went pending, while both of the other two homes featured last month have already sold.
Stats snapshot for Seattle Single-Family Homes Under $200,000 (excluding short sales)
Total on market: 84
Average number of beds: 2.7
Average number of baths: 1.3
Average square footage: 1,275
Average days on market: 74
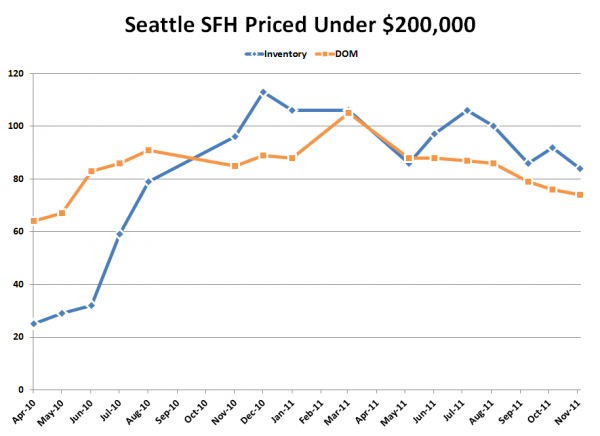
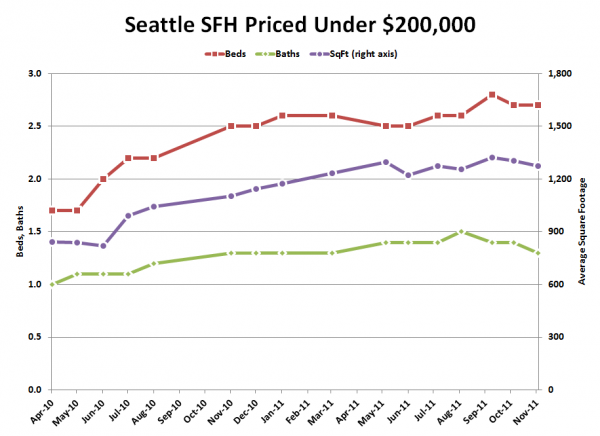
Inventory, baths, square footage, and days on market all slid between October and November, while beds held steady. It seems that even the bottom end of the market is headed into winter already.
Here are a couple of charts to give you a visual of the trend of these numbers since I adjusted the methodology in April 2010:
Here are cheapest homes in Seattle that actually sold in the last month in arms-length transactions, regardless of condition (since most off-market homes don’t have much info available on their condition).
| Address | Price | Beds | Baths | SqFt | Lot Size | Neighborhood | $ / SqFt | Sold On |
|---|---|---|---|---|---|---|---|---|
| 7920 15th Ave SW | $68,000 | 3 | 1.0 | 1,260 | 4,200 sqft | Delridge | $54 | 10/12/2011 |
| 3036 SW Roxbury St | $80,000 | 3 | 1 | 950 | 5,000 sqft | Delridge | $84 | 10/25/2011 |
| 4249 S Findlay St | $84,900 | 3 | 1.0 | 1,090 | 7,828 sqft | Columbia City | $78 | 10/07/2011 |
I received a note last week from the buyer of a home that didn’t quite make the list, but was one of the ten cheapest homes sold in Seattle in October.
I just purchased what I believe to be one of the cheapest homes in Seattle in October of this year; sadly, it didn’t make your list, but in the present condition quite habitable. Regardless, I thought you might like a street-level view of the housing bubble from one of these purchasers – namely, me.
At the peak (2006) this house sold for 305k. That’s quite a discount for Seattle, even for a government owned home.
I sold a house in Wallingford in 2009 that I owned for 10 years (through Redfin) and socked the money away ($290k in 2000, $475k sale price after much effort) and now own a home mortgage-free. West Seattle/Highland Park sure isn’t Wallingford, but free-and-clear sure isn’t a $250k mortgage, either.
At the while, friends questioned my choices (why sell – it’s worth so much, all the way to why sell – it’s worth so much less). I do feel that I was very close to the heart of the bubble.
I certainly didn’t ‘want’ to sell my Wallingford home, any more than a person deeply underwater wants to lose theirs. But at some point, the numbers don’t lie, and it’s the best/smartest thing to do at a given time in one’s life.
Great story. Way to take advantage of the market and put yourself in a strong financial situation.

