This is fairly off-topic (although we have covered this subject occasionally in the past), but with all the teeth-gnashing I’ve been reading about lately regarding the latest round of supposedly major cuts required to keep state spending in line with revenues, I thought it might be interesting to look at a couple of charts on the subject.
Here’s an example of the rhetoric floating around out there regarding the latest round of budget tightening, with the governor making the case for a “temporary” sales tax increase:
Seattle Times, November 21: Gregoire proposes half-cent sales-tax increase
Gregoire wants lawmakers to put a referendum on the March ballot asking for a temporary half-penny boost in the sales tax, which would bring in nearly $500 million a year. The tax would expire after three years and largely would go toward education, with smaller amounts for public safety and social services.
The governor’s proposal came after she outlined more than 160 proposed budget cuts to fill the gap. The cuts included eliminating state-subsidized health insurance for the working poor; reducing the K-12 school year by four days; and allowing early release of prisoners who are at low to moderate risk of reoffending.
Some reductions would be rescinded if the tax increase is approved.
“I have seen the ramifications of the cuts,” Gregoire said. “I can’t live with it.”
Today, protesters descended on the state Capitol in Olympia to protest these allegedly intolerable cuts.
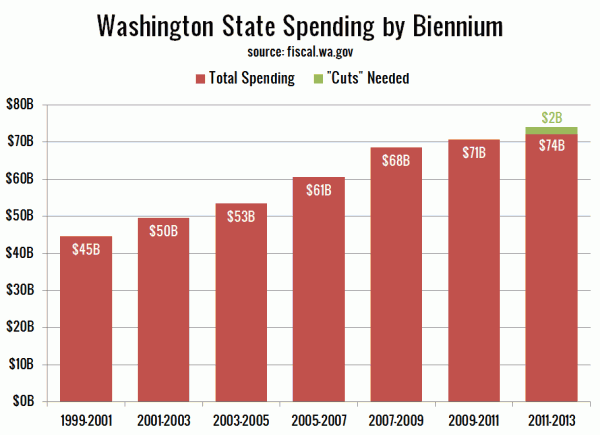
Here’s a look at Washington’s total budgeted spending for each biennium, with the budget hole that everyone is making a big deal about overlaid in green:
When the total budget is $74 billion, cutting $2 billion doesn’t seem like quite as big of a deal. We’re talking about 2.7% of the budget. It also seems worth noting that even with these annual cuts we keep hearing about, the total budget has still managed to grow 5.2% since the 2007-2009 biennium.
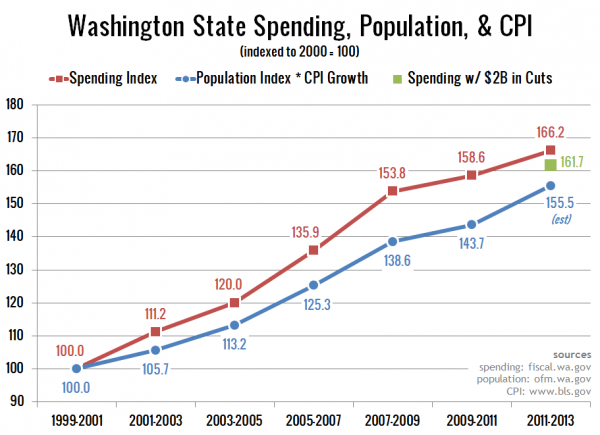
Of course, straight dollars don’t quite tell the whole story, so here’s a chart in which I’ve indexed total state spending to 100 in the 1999-2001 biennium, and plotted it alongside an index of population, multiplied by the growth in national CPI (less shelter):
State spending has managed to grow a total of 61.7% over the last twelve years (after the $2B in cuts), vs. a total growth of 55.5% for population times inflation. So I can’t help but wonder… where exactly is the pressing need to increase state taxes or cut vital services?

