In late June’s post where I plotted the long-term trend of inflation-adjusted local home prices, there was some disagreement with my snarky insinuation that zero real appreciation over thirteen years (1999 to 2012) represents a lousy investment.
As one reader correctly pointed out, the stock market’s total non-inflation-adjusted return over the same time period is a paltry 5.1%, which turns into a loss of 26% after you adjust for inflation. Even if you ignore the leverage you get from your down payment and the additional principal you paid into the mortgage over that time period, zero growth in home prices still beats a 26% loss in the stock market, right?
Of course, home ownership is a complex financial commitment, and simple comparisons of purchase and sales prices don’t tell the whole story.
Five years ago I published a rent vs. purchase spreadsheet that takes into account interest rates, home appreciation, maintenance costs, insurance, income tax deductions, and as many other factors as I could fit into a single spreadsheet. I’ve maintained and updated that spreadsheet over the years, so let’s use it to run a few sample scenarios for various investments between Q2 1999 and Q2 2012.
I’m not going to get into every little detail of how I’m coming up with the numbers below. If you want to see the complete breakdown, just download the spreadsheet and play around with it yourself.1
For the purposes of this post, I’ll be comparing the purchase of a median-priced King County home in the second quarter of 1999 ($229,650) financed with a fixed-rate 30-year mortgage and 20% down ($45,930), with renting and using two possible alternative investment options for the down payment: Buying an S&P 500 stock index (average yearly gain of 0.38%) or buying 10-year Treasury bonds (average yearly gain of 4.2%).2 For the rent scenario we’ll be adding the renter’s monthly savings to the investment.
Here’s a table of the total net costs for each option at various points:
| Buy a Home | Rent+Stocks | Rent+Treas. | |
|---|---|---|---|
| Year 5 | ($76,080) | ($27,221) | ($20,128) |
| Year 10 | ($130,115) | ($67,736) | ($48,379) |
| Today | ($159,780) | ($98,914) | ($69,427) |
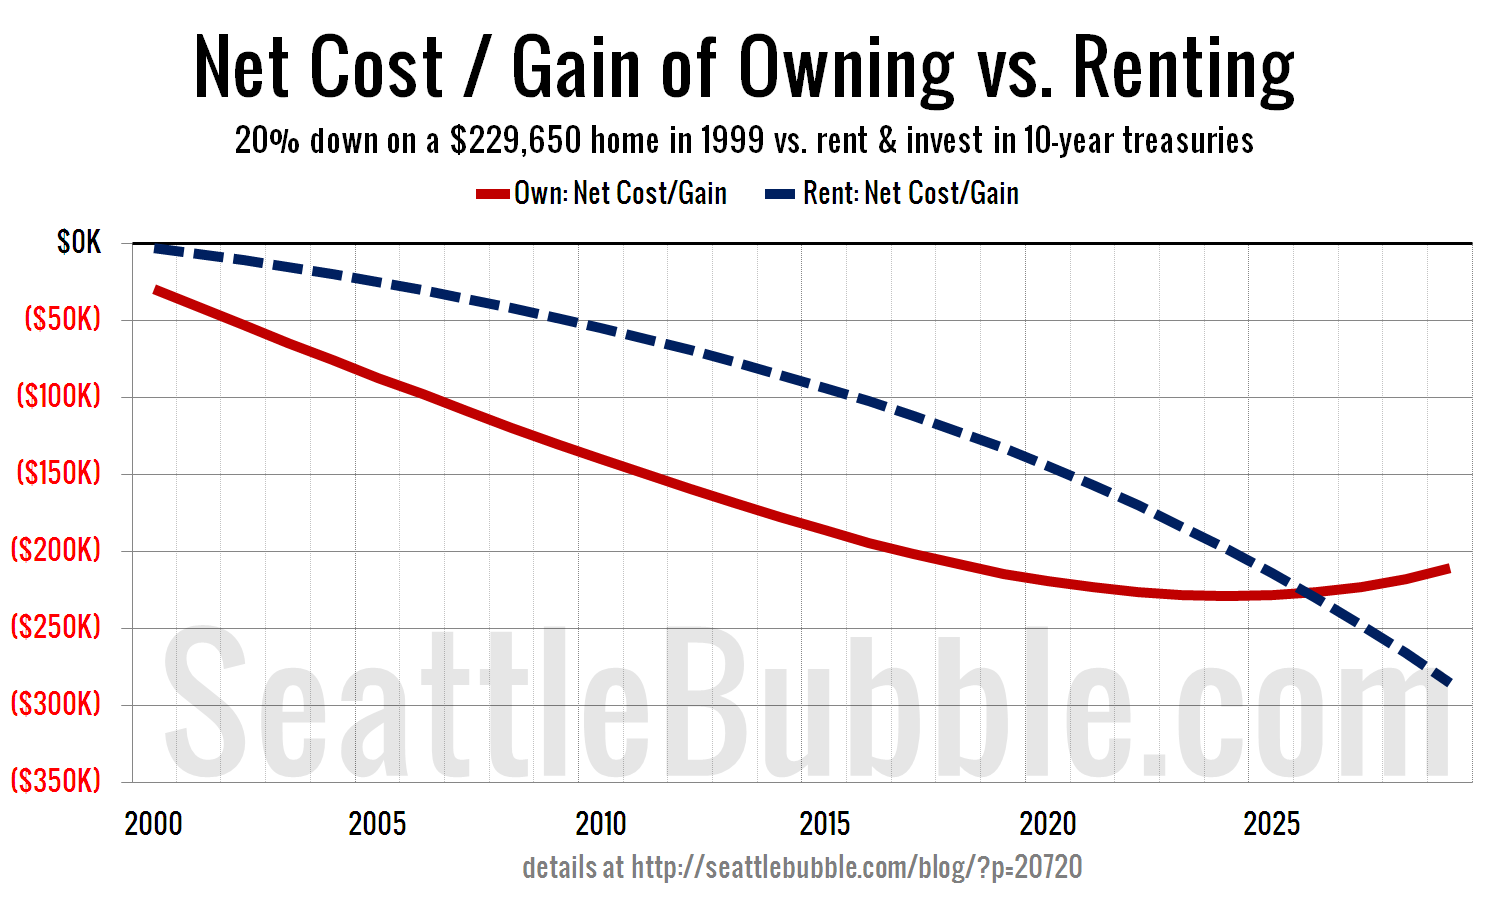
Buying a home in 1999 becomes the better financial choice than renting and investing in the stock market by year 22 (2021), while it takes until year 27 (2026) to beat investing in 10-year treasuries.
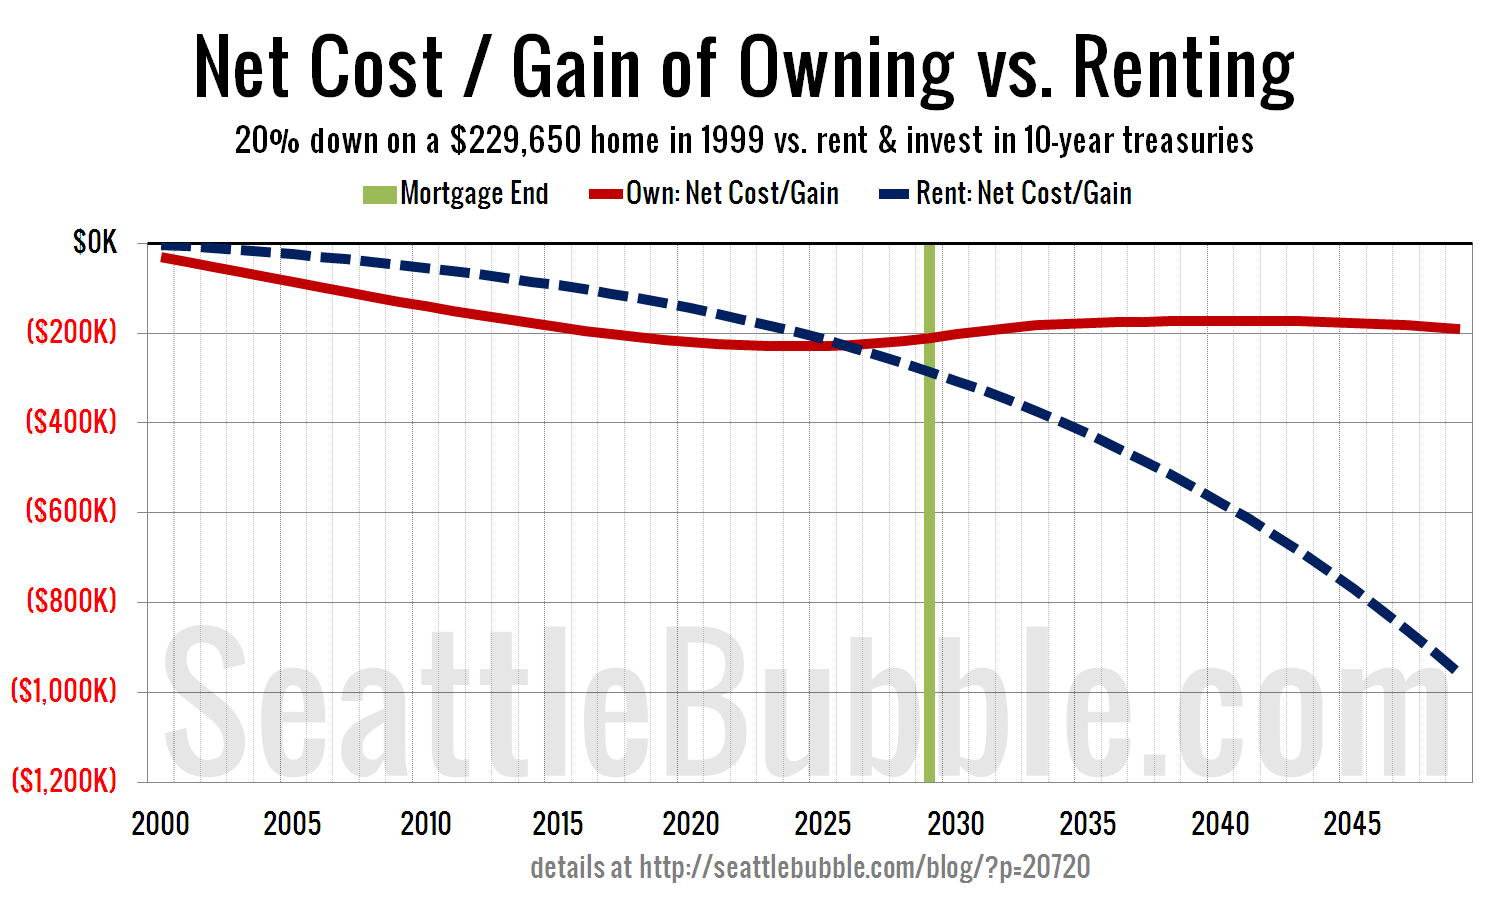
Here’s what the buy vs. rent scenario looks like in chart form out to 30 years if the renter had invested in treasury bonds.
20 years is a pretty long time by most people’s standards, and yet it isn’t long enough for buying with a mortgage to beat renting and investing your savings.
However, if you’re the kind of person that is pursuing actual home ownership instead of serial debtorship, the situation gets dramatically better for you once you finally pay off the mortgage:
Home ownership can be a good investment, but not the way most people do it. Buying a home and “trading up” or moving around every seven to ten years is not investing in real estate. It’s renting money from a bank so you can enjoy the perks of “ownership.”
Actually owning your home—debt free—is the only way to make your home an actual investment.
2 Note that for both investment options I’ve simplified the returns to a simple yearly average. In reality treasuries would return more than that over the 13-year period since most of the 10-year bonds you would have purchased would have been at rates closer to 5.5%, and stocks would have performed better since you would have continued investing as the market crashed in 2001 and 2008.

