Before we put away the June Case-Shiller data, let’s have a look at my favorite alternative Case-Shiller charts.
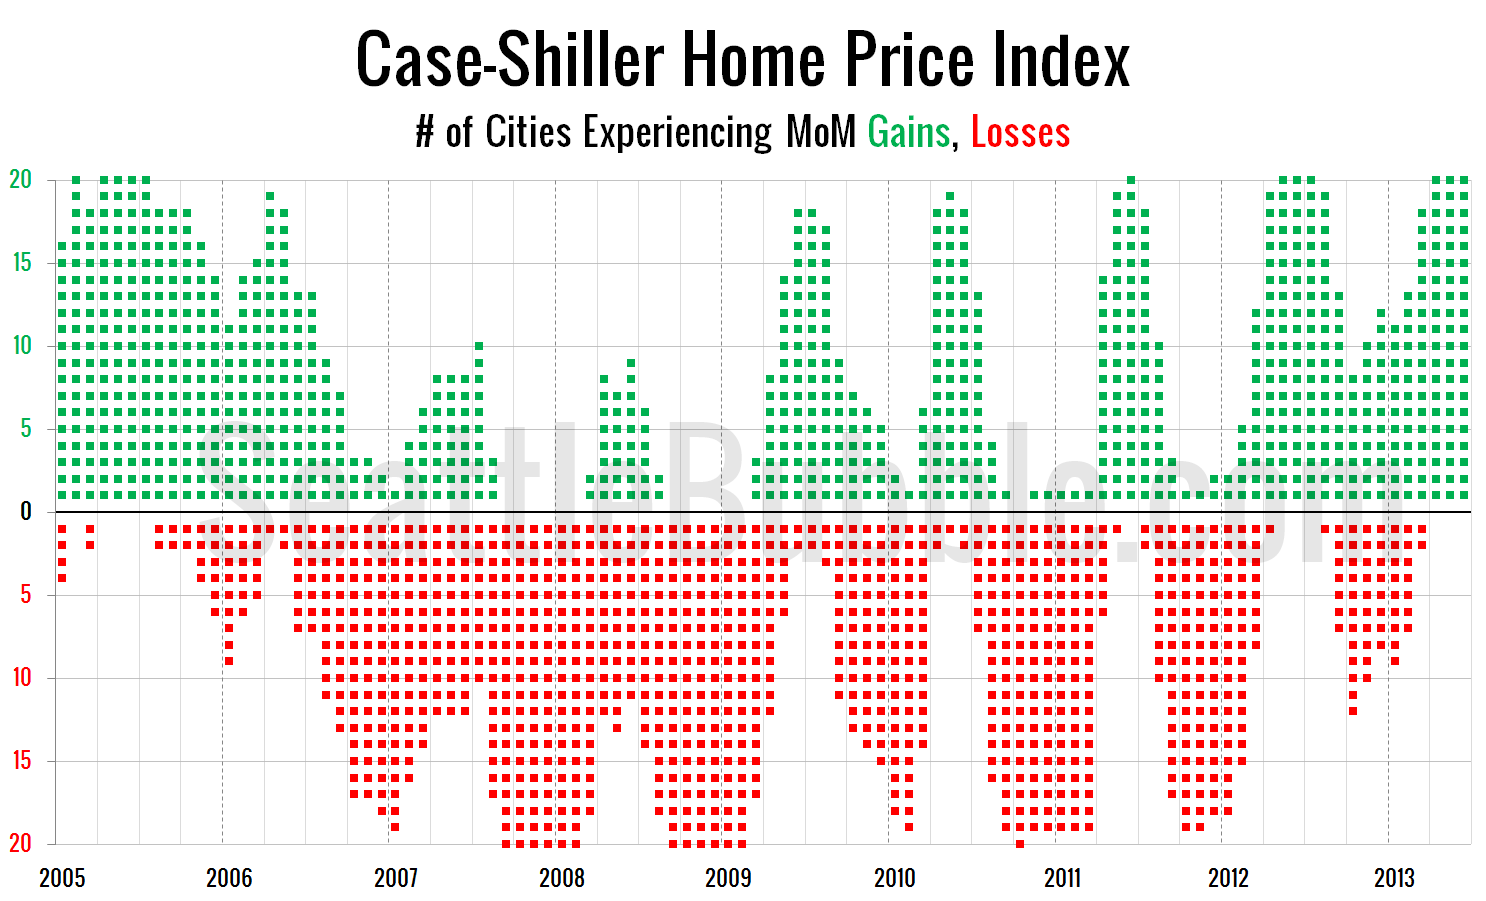
First up, let’s take a look at the twenty-city month-over-month scorecard. Here’s the original post introducing this chart if you’d like more details. Click the image below for a super-wide version with the data back through 2000.

As of June all twenty cities are still experiencing month-over-month gains, for the third month in a row now.
Interestingly though, the second derivative gains continue to turn to losses… here’s a look at the number of cities that are experiencing second derivative Case-Shiller gains or losses.
 Gains, Losses - Click to enlarge")
The number of cities experiencing second derivative gains continued to plummet in June, with just seven cities experiencing gains—the lowest number since November 2011. I still expect this trend to lead to prices flat-lining in most markets by the end of the year, which we’ll see in the data released by Case-Shiller in late February.