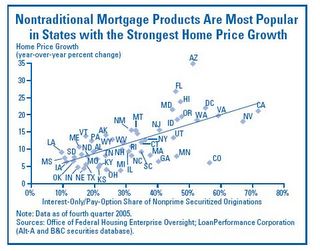
A perceptive reader pointed out a post at Calculated Risk that pointed to a 29-page report by the Federal Deposit Insurance Corporation (pdf). The interesting piece of information is contained on page 25, in Chart 4, reproduced below.
And here’s the money quote from the write-up:
Nontraditional loan products can be appropriate for financially savvy borrowers with low credit risk. Indeed, many of these products have been offered for years to such borrowers, and credit quality generally has been good. What has changed, however, is how these loans have been marketed and used in recent years. Lenders have targeted a wider spectrum of consumers, who may not fully understand the embedded risks but use the loans to close the affordability gap.
The degree to which mortgage market innovation, fueled by significant MBS liquidity, boosted home sales last year is unknown. Anecdotal evidence suggests that affordability and financing played a strong role in extending the volume component of the mortgage credit cycle last year. For example, there is a correlation between nontraditional mortgage loans and home price growth. An analysis of state-level data from LoanPerformance Corporation shows the penetration of IOs and pay-option ARMs for nonprime borrowers into areas with strong price appreciation and reveals a strong positive relationship between the concentration of such loans and home price growth (see Chart 4). This analysis illustrates the recent development of borrowers increasingly using IOs and pay-option ARMs to purchase homes they might not otherwise have been able to afford. A June 2006 study by Harvard’s Joint Center for Housing Studies also confirms this trend.
Analysts are concerned that higher-risk borrowers are more likely to be affected by a major payment shock during the life of their mortgage and may be more likely to default. Compounding this possibility is the fact that the increasing availability of mortgage credit is occurring at a time when mitigating controls on credit exposures have weakened.
A number of readers agreed with the FDIC’s statement. You would expect that more “nontraditional” mortgages would mean more defaults (and therefore more foreclosures). However, that hasn’t really panned out in Washington State (yet). Although we’re 6th-highest on the graph above, with around 55% of mortgage originations being nontraditional, we are down at number 18 for foreclosure rates, with 1 for every 1,460 households. Not only that, but as reader Christina pointed out, many of the states with the fewest nontraditional mortgages have surprisingly high foreclosure rates. (For example, Texas, Indiana, Ohio, Oklahoma, and Tennessee all have less than 30% nontraditional mortgages, but higher foreclosure rates than Washington.) Christina asks:
I want to know why on the chart of negatively amortizing loans, the states on the low end of the line have the highest percentage of foreclosures.
Sarah gives a possible explanation:
Christina- here’s my guess, those areas did not appreciate as wildly as some others, so people were not able to unload as quickly and for ever greater amounts of $ and wound up in foreclosure.
CA foreclosure rates have only recently been starting to go up, now that the market has finally turned there.
It’s the areas with the greatest amounts of appreciation that were forced into using the neg am loans as houses became increasingly unaffordable.
But the flip side of that is that those same areas, for a time anyway, were able to sell homes quickly and at a profit to avoid foreclosure. Since everyone was on the mania train and there were buyers aplenty.
As the market turns, my guess is they’ll be plenty of foreclosures in the most egregiously overpriced markets, Seattle included.
I agree with Sarah’s analysis. The big question is what will happen if/when appreciation levels off (or heads into negative territory), while interest rates continue to climb. I’ll leave that as an exercise for the reader.
(FDIC, Summer 2006)
(Press Release, RealtyTrac™, 05.16.2006)
