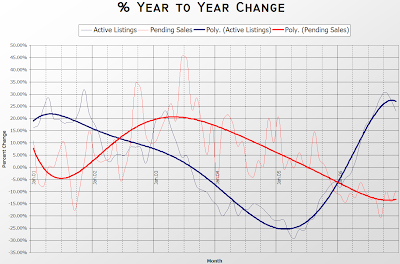
December stats are available from the NWMLS. Here’s a summary of the “residential” figures:
Active Listings: up 23% YOY
Pending Sales: down 9% YOY
Median Closed Price: $440,000, up 12% YOY.
I’ll update this post later today with the usual graph and links to the updated spreadsheet and the NWMLS pdfs.
Update: Sorry about the delay. Here’s the Seattle Bubble Spreadsheet, and here is the latest inventory & sales graph:
As you can see, inventory jumped slightly less YOY than it has in recent months, and sales dropped YOY slightly less than they have in recent months. Is this the beginning of a trend toward inventory and sales stabilization? I’m going to go with “no” for now. We’ll really see come March.
