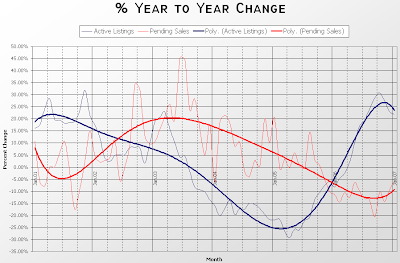
An inside source has supplied me with the latest NWMLS statistics, and they tell exactly the story you would expect if you’ve been paying any attention at all during the prior nine months. For what is now the tenth month in a row, inventory was up and sales were down YOY. In fact, sales have been in the negative YOY since November 2005, making January the fifteenth consecutive month of declining sales.
Here’s your SFH summary:
January 2007
Active Listings: up 22% YOY
Pending Sales: down 6% YOY
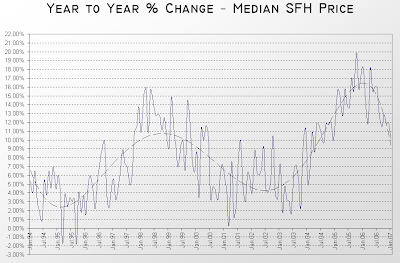
Median Closed Price: $429,495, up 10% YOY
As is the custom, I have uploaded an updated copy of the Seattle Bubble Spreadsheet that contains the relevant data. The public NWMLS pdfs are not available yet, but when they are I will update this post with the link. [Update: And, here it is.]
Here’s the supply/demand YOY graph:
It would be a stretch to call the upward curve on the sales graph a “recovery” since it is still in negative territory, but sales are certainly now slowing as much in the last few months as they were during the summer months. Will we see the all-powerful “spring bump”? We’ll know in just a few months…
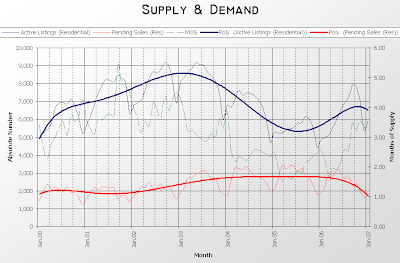
Here’s the chart of supply and demand raw numbers:
Finally, just because I’m in a charty type of mood (also I’m in Atlanta and there’s nothing much better to do), here’s a graph of the YOY percent change in the median sale prices of single-family homes in King County since 1994:
Wow, that latest dip sure is steep… Huh.


