February statistics from the NWMLS have been posted. As is the custom, the Seattle Bubble Spreadsheet has been updated and uploaded.
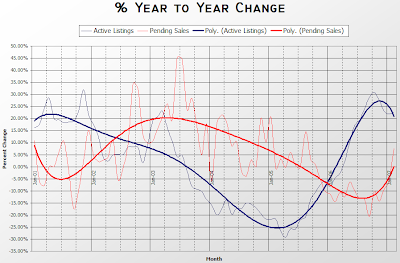
Some of my guesses for King County were fairly close, with the notable exception of Pending Sales (Res), which shot up to 2,375. That’s +7.66% YOY, ending the 15-month streak of declining YOY sales.
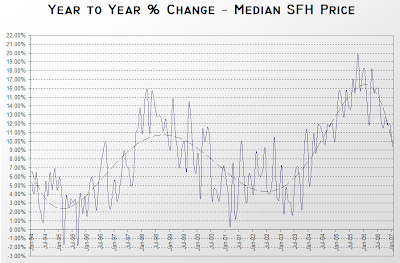
Interestingly, despite the sudden surge in buyers last month, the median price was essentially flat compared to January, thus leading to the first single-digit YOY increase in median price (+9.41%) in over two years. This could be because although the number of sales is finally on the rise, the amount of inventory is still rising considerably quicker (+7.66% vs +22.50%).
Here are the vitals, with my guesses following:
Median Price (Closed)
Res + Condo: $393,250, +14.00% ($372,000)
Residential: $429,925, +9.41% ($425,000)
Condo: $285,250, +24.59% ($272,500)Res Only
Active Listings: 6,124, +22.50% (6,250)
Pending Sales: 2,375, +7.66% (1,900)
Here’s the supply/demand YOY graph:
Here’s an update to the graph I posted last month of the YOY percent change in the median sale prices of single-family homes in King County since 1994:
I predict that the local press will focus their reports on the increased number of sales, while downplaying the still-declining rate of “appreciation.” Just a hunch.
(NWMLS, February 2007 Recap, 03.2007)

