Let’s play a game. It’s called “Spot the Fundamentals,” and the way we play it is by looking at some of the “fundamentals” to figure out which ones are responsible for our area’s high home prices.
The frequent condescending argument of the cadre of Seattle area housing bulls (real estate agents, “analysts,” the press, and increasingly combative blog commenters—whom I suggest we all ignore) is that unlike most of the rest of the nation, Seattle home prices are firmly supported by strong fundamentals such as exceptional job growth, high-paying jobs, and increasing population, and as such will not decline.
Let’s play “Spot the Fundamentals” to see how well that claim holds up.
Job Growth
The Seattle area has “strong job growth,” right?
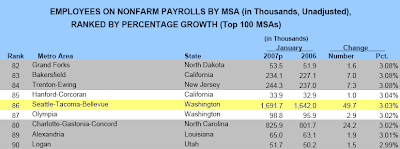
Well sure, if you call 3% growth in the last year “strong.” Of course, while Seattle was one of the few parts of the nation where housing prices rose double-digits last year, there were 85 Metropolitan Statistical Areas that had better “job growth.”
Unfortunately for the Bull Cadre, a 3% increase in jobs does not account for an 11% increase in home prices during the same time frame. As we have previously explored in detail, job growth (and reduction) in the Puget Sound has had little to no correlation with housing prices.
High-Paying Jobs
Yeah, but even though the job market isn’t growing by leaps and bounds, thanks Microsoft, salaries are shooting through the roof… right?
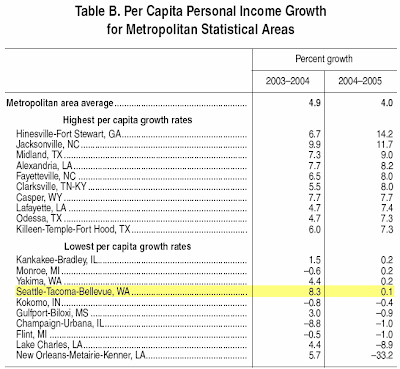
Hmm, maybe not. In fact, income growth in the Seattle area was so slow recently that we made it onto a “lowest of” list. Somehow I must have missed it when that little news tidbit hit the papers.
Another swing and a miss for the Bull Cadre.
Population Growth
Well, people are moving here faster than ever, so that pretty much forces home prices higher, doesn’t it?
| County | 2000 pop. | 2005 est. | % chg. | %/year |
|---|---|---|---|---|
| King | 1,737,034 | 1,793,583 | 3.26% | 0.64% |
| Pierce | 700,820 | 753,787 | 7.56% | 1.47% |
| Snohomish | 606,024 | 655,944 | 8.24% | 1.60% |
(source)
Not. If there actually were people moving here in droves, then yeah, that would explain home prices rising an average of 9.4% per year (King County SFH, 2000-2005). However, that clearly does not describe reality.
Looks like strike three for the Bull Cadre.
Fundamentals vs. Speculation
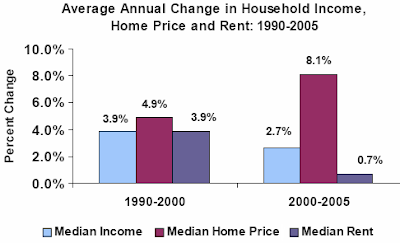
Here’s a refresher:
As I have demonstrated before, Seattle area rents (which are not subject to speculation) have indeed been tracking fairly well with “the fundamentals.” Home prices clearly have not.
How anyone can (with a straight face) argue that “strong fundamentals” will prop up Seattle area housing prices, when they have so clearly been propelled by factors other than fundamentals, is completely beyond me. You can believe whatever you want to believe about where prices will go from here, but to say that they will be propped up by “strong fundamentals” is just willful ignorance, in my opinion.
If anyone believes they can explain how Seattle home prices have actually been tied to fundamentals since 2000, and wishes to civilly bring such an argument to the table, backed up by hard data (such as what is found in this post), then by all means be my guest. However, don’t waste your time with one-liners, “bitter renter” put-downs, and simplistic observations of inventory and ongoing price increases, as they will be ignored.
(Bureau of Labor Statistics, US Dept. of Labor, 01.2007)
(Bureau of Economic Analysis, US Dept. of Commerce, 09.2006)
(US Census Bureau, Population data: 2000-2005, 2005)
(King County Budget Office, Affordable Housing 2006, 01.2007)
Thanks go out to reader Dennis O. for pointing out some of the data in this post.


