It’s time for April statistics from the NWMLS. King County SFH summary:
April 2007
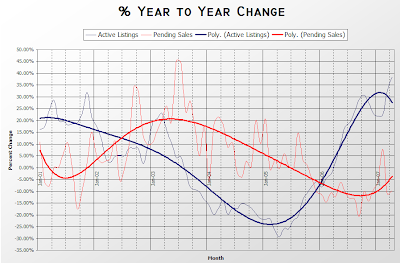
Active Listings: up 38% YOY
Pending Sales: down 10% YOY
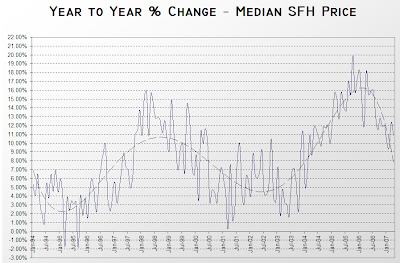
Median Closed Price: $465,000, up 11% YOY
Sales continued their descent, making April the 17th of the last 18 months to register a YOY decrease in pending sales. Likewise, inventory continues to balloon, registering the highest YOY increase to date.
Despite the downward pressure of increasing supply coupled with decreasing demand, median prices still rose $10,000, for a 10.85% YOY increase. Apparently the increasingly small number of people that are still buying are all too happy to continue paying higher prices. Perhaps they’re frightened of being priced out forever.
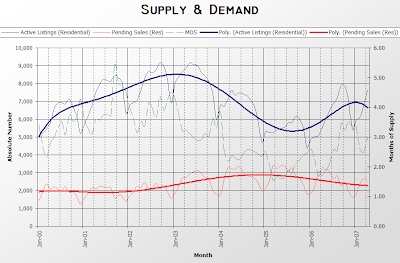
Months of supply bumped back up to 3.00.
As is the custom, I have uploaded an updated copy of the Seattle Bubble Spreadsheet that contains the relevant data. Here is the recap NWMLS pdf.
Here’s the supply/demand YOY graph:
Here’s the chart of supply and demand raw numbers:
Here’s the graph of YOY percent change in the median sale prices of single-family homes in King County since 1994:
I predict that the $10,000 increase in median prices will be the primary focus of our friends at the Times and P-I.
Tick, tock, tick, tock…


