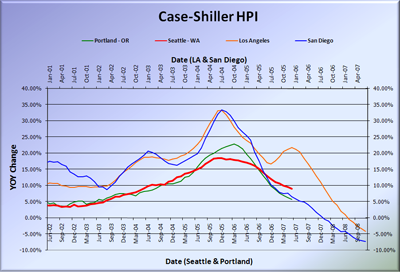
As many of you have already noticed, the latest Case-Shiller data (June) has been released. Here’s an update of the graph I’ve been keeping of the west coast cities:
For those that are into this sort of thing, here’s what Aubrey Cohen over at the Seattle P-I had to say about the latest data:
Seattle-area home appreciation continued its long slide back to reality in June, according to data released Tuesday.
The typical home in King, Pierce and Snohomish counties was worth 7.9 percent more in June than a year earlier, but June had the lowest increase since February 2004 and was the 16th consecutive month of slowing growth, according to the S&P/Case-Shiller Home Price Indices.
Still, while market observers say that the national housing credit crunch is affecting the area’s market, Seattle had the largest yearly increase of the 20 metropolitan areas the indices track and was one of just five with increasing values.
…
A 7.9 percent annual growth rate still is extremely good, Matthew Gardner, a local land-use economist, said Tuesday. “No markets can continue to see real estate values spiraling and double-digit annual appreciation rates. It doesn’t work.”
…
Annual appreciation is expected to continue to slow until the end of this year and possibly into early next year, Gardner said. “I think we’ll probably end up somewhere between 3 and 5 percent.”
From the looks of the above graph, Seattle appears to be right on schedule… If the local real estate bulls such as Matthew Gardner are correct, we’ll see the red line drop another 2-3 points, then completely level off. Is it possible? Sure. It’s also possible that the legions of crows that fly by my house every day at dawn and dusk are really robotic spies, deployed by clandestine Soviet Union operatives poised to carry the motherland out of the shadows and onward to glorious new heights.
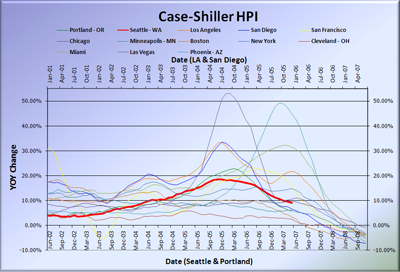
Just to give you an idea of how ridiculously unlikely it is that Seattle will escape unscathed, as the sole beacon of housing appreciation light in the dark valley of the bursting national bubble, behold the following graph, which shows thirteen of the twenty Case-Shiller-tracked cities (with Seattle and Portland still time-shifted back 15 months):
You should note that while there are examples of cities that saw home prices rise much higher and faster than Seattle and are already falling much harder (Las Vegas, Phoenix), there are also examples of cities that never saw much more than 10% YOY appreciation, and yet have already hit negative YOY (Chicago, Minneapolis, Boston). The “we didn’t rise as much” excuse really holds no water at all.
In fact, looking at that graph, the existence of robotic USSR spy crows seems more likely than a near-future return to steady 5% appreciation for Seattle. I suppose that by this time next year, either Matthew Gardner or The Tim will look like a fool. We shall see.
(Aubrey Cohen, Seattle P-I, 08.29.2007)

