Unlike the other cities across the country that experienced surging prices and are now seeing price declines, Seattle will be immune from such forces. Why? Because of our strong employment, of course! Here in Seattle, our job market is so much better than the rest of the country, there’s no way our home prices could falter!
Wait, really?
Let’s check out the latest unemployment statistics to see how that claim holds up. In the table below, I have compiled the September unemployment rate and the Case-Shiller HPI YOY change (as of July). For the nationwide statistic, the Case-Shiller HPI refers to the 20-city average. Metro areas are sorted by unemployment rate, in descending order.
| Unemp. | CS-HPI | Source | |
| Nationwide | 4.7% | -3.91% | Seattle Times |
| Detroit | 7.9% | -9.69% | Detroit Free Press |
| Las Vegas | 5.2% | -6.14% | Nevada Appeal |
| L.A. County | 5.1% | -4.75% | L.A. Business Journal |
| New York City | 5.1% | -3.78% | New York Sun |
| Charlotte | 4.8% | +5.97% | BizJournals |
| San Diego County | 4.8% | -7.78% | Signs on San Diego |
| Boston | 4.7% | -3.37% | Boston NOW |
| San Francisco | 4.2% | -4.14% | San Francisco Chronicle |
| Miami-Dade County | 4.1% | -6.45% | South Florida Sun-Sentinel |
| King County | 3.9% | +6.86% | Seattle Times |
| Phoenix | 2.8% | -7.30% | Arizona Republic |
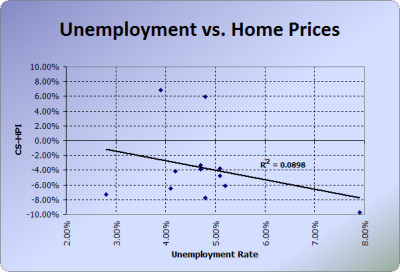
Is it just me, or does that data appear to be all over the place, with little to no correlation between unemployment and the trend of housing prices? Let’s take a page out of Deejayoh’s book, and check out a scatterplot:
Nope, not just me. There appears to be little to no correlation between unemployment statistics and home prices. Since unemployment statistics are generally considered to be a decent measure of the relative strength of an area’s job market, I think we can yet again conclude that “strong employment” is not sufficient to prevent home price declines.
