It’s been about a month since I introduced the Distressed Sellers Index, so I thought it would be a good time to check in with another update.
Here’s the latest graph:
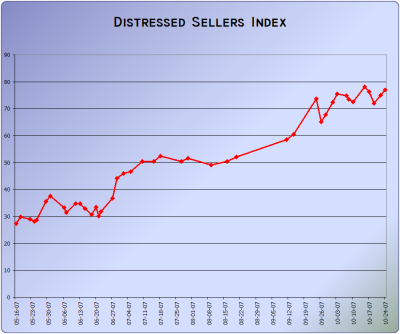
As you can see, since our last update the DSI has jumped nearly 20 points up into the 70-80 range, where it has been holding somewhat steady. The latest reading came in at 77.
Again, I’d like to remind you that the DSI is non-scientific, and is provided merely as a curiosity. A value of 77 has no particular “meaning” other than the general theory that higher index values means more distressed sellers in the Seattle area. I’m not attempting to make any claims regarding predictive or even descriptive qualities of this index. We’ll need more than a few months’ worth of data before we can begin to form any such hypotheses.
Continuing with the excellent suggestion from the previous DSI post, here is the current DSI for select additional cities as of today:
- Boston: 83
- Las Vegas: 148
- Sacramento: 153
- Miami: 137
- San Diego: 206
- Los Angeles: 138
- Phoenix: 201
