Wow, January stats from the NWMLS are already here. When the press release with pdf links is released I’ll post it here. (Update: Here it is.) For now, here’s the summary along with the usual graphs and other updates. Now with bigger chart thumbnails!
Here’s your King County SFH summary:
January 2008
Active Listings: up 56% YOY (new record)
Pending Sales: down 31% YOY
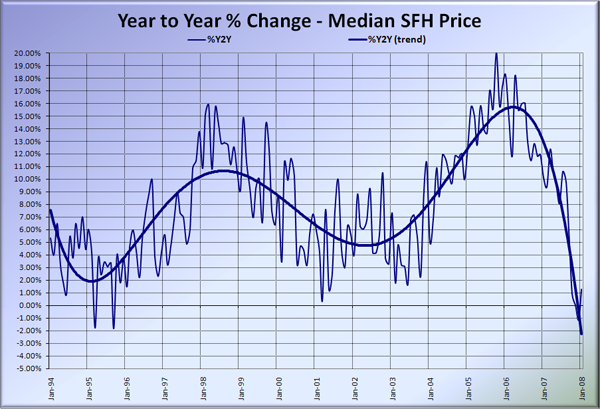
Median Closed Price*: $435,000 – up 1.28% YOY
I’m surprised to see the median holding its ground at $435,000 for the third month in a row, but with sales at all-time lows, the changes in the median price are becoming less and less informative every month.
Here is the updated Seattle Bubble Spreadsheet, and here’s a copy in Excel 2003 format. Click below for the graphs and the rest of the post.
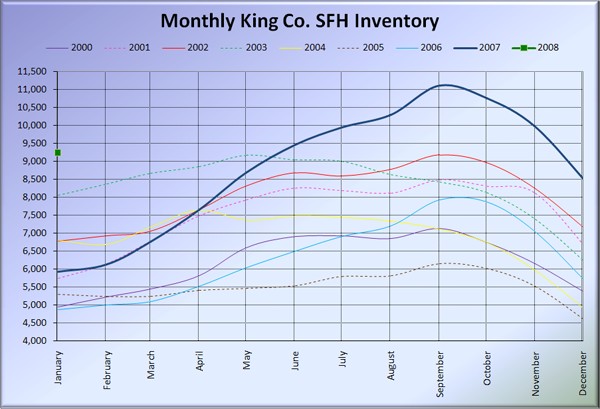
How many months in a row can I be surprised at how fast YOY inventory is growing? Yowza, 56% more homes on the market than January 2007, which itself had 22% more homes on the market than January 2006—that’s crazy. The green square on left side of the graph below shows just how crazy inventory is getting. We’re starting 2008 at a higher point than the peak of any other year save for 2007.
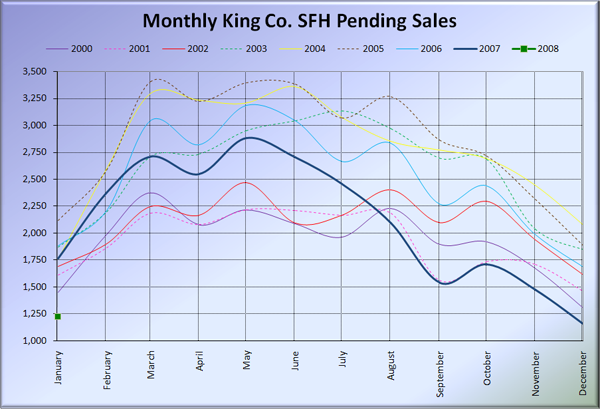
The total number of sales continued to plummet in January, down another 31% from last year. As you can see below, this is the worst January on record since before 2000. The months of supply held its ground at exactly last month’s level of 7.54. That’s now five straight months of MOS above 6.
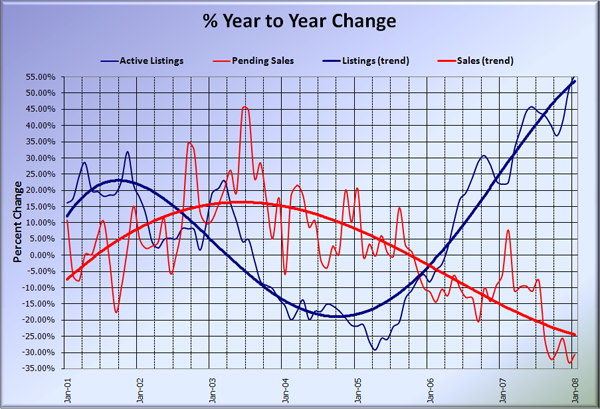
Here’s the supply/demand YOY graph. It looks like I might have to adjust the vertical axis if current trends continue. Higher for the inventory and lower for the sales.
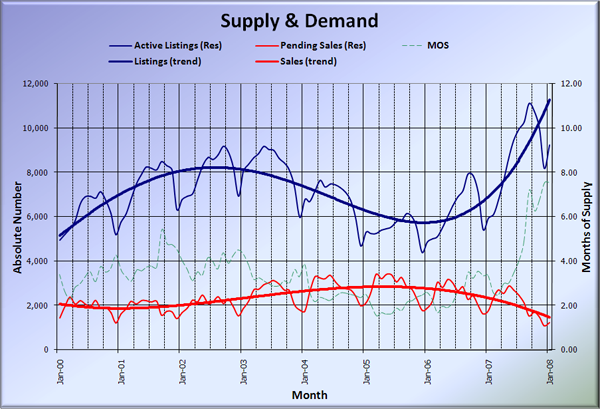
Here’s the chart of supply and demand raw numbers:
Here’s the SFH Median YOY change graph. Have we bottomed out? I doubt it.
Here are excerpts from the blurbs from the Times and the P-I. Check back tomorrow for the reporting roundup.
Drew DeSilver, Seattle Times: Homes sales slump in January in Puget Sound region
Home sales continued to sag in the four-county Puget Sound area last month, and median sales prices — with the sole exception of single-family homes in King County — slipped further, more proof that the region has joined in the nationwide housing slump.
Data released today by the Northwest Multiple Listing Service showed just 2,712 closed sales in King, Snohomish, Pierce and Kitsap counties last month, a 35.4 percent drop from the 4,197 recorded in January 2007. Nearly 3,300 sales were pending across the region, 32.4 percent fewer than a year ago.
Aubrey Cohen, Seattle P-I: Seattle-area house prices edged up in January
Seattle-area house prices edged up in January from a year earlier, while condo prices dipped.
The median house price was $430,000 in Seattle, $435,000 in the county and $334,000 in the 19 counties in the Northwest Multiple Listing service combined, up about 1.2 percent in the city, and 1.3 percent in the county and region from January 2007, the listing service reported.
…
Although statistics do not show sales picking up, local real estate agents have been saying since early in the year that they see activity picking up.
Forget statistics. Agents can feel the recovery in their gut.
