When I posted last week’s 61-year home price history, I promised a follow-up on affordability. So, here it is.
Before I get to the chart, here’s a quick refresher on what the “affordability index” is, and what it isn’t. What it is is a simple measure that shows relationship between median home prices, median household incomes, and interest rates. It is calculated by determining the monthly payment (principal and interest) that would result from buying the median-priced home, assuming a 20% down payment and current interest rates on a 30-year fixed-rate mortgage, then comparing that to 30% of the monthly median household income (the standard measure of “affordable housing”). Thus, an affordability index of 100 means that the median household would pay exactly 30% of their monthly income toward the mortgage of the median-priced house. Above 100 is more affordable, while below 100 is less affordable.
The affordability index does not take into account lending standards or exotic mortgage availability. It also does not necessarily indicate that an area is overpriced if the affordability index is below 100. More desirable areas are inherently less affordable. No reasonable person would expect housing in Bismark, ND to have the same affordability index as New York, NY. What is somewhat instructive however, is comparing the affordability index of a given area to that same area’s affordability index in the past. How convenient then, that this is exactly what we are doing with this post.
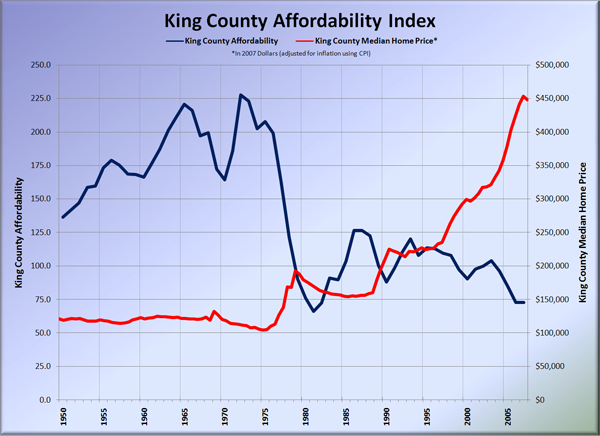
What you see below is a graph of the Affordability Index for King County from 1950 through 2007. For ease of reference, I’ve overlaid the graph of inflation-adjusted home prices on the right axis, so you can see how the two relate. I want to note though, that when calculating the affordability index, actual home prices are used, not inflation-adjusted prices.
From 1950 to 1970, while home prices more or less just kept up with inflation, affordability was sky-high, reaching peaks as high as 227. Of course, it shouldn’t come as a real surprise that when home prices began to jump up in the mid ’70s, affordability dropped like a rock. Of course, home prices are only part of the equation. Affordability tanked from 1976 to 1981 not only due to a leap in home prices, but an even more extreme spike in interest rates. On the following graph you can see the other two components of the affordability index: median incomes and interest rates.
I should point out that pre-1971 interest rate data is quite difficult to find, and I was forced to make my best estimate based on a chart of 30 Year FHA Mortgage Rates. Also, I believe that sometime during the period that is displayed on the graph, the “standard” mortgage shifted from a 15-year to a 30-year term. I couldn’t locate any data on historical mortgage standards to back that up, but maybe one of our resourceful readers can. Even with the ridiculously high interest rates of the early ’80s, the long-term average of the affordability index through the ’80s and ’90s comes out to 101.9. Here are the averages for each decade since the ’50s:
- 1950s: 160.6
- 1960s: 194.6
- 1970s: 178.4
- 1980s: 97.4
- 1990s: 106.5
- 2000-2007: 89.7
The affordability index for 2007 stood at 72.5, which is 29% lower than the 1980-1999 average. To get back in line with long-term trends, the affordability index would have to increase by approximately 40%. This could happen through increasing incomes, falling home prices, or falling interest rates. Lower rates seems fairly unlikely, so I’m predicting that it will be some combination of the first two, with the emphasis on the falling home prices.
This analysis may remind you of Deejayoh’s excellent post that compared disposable income, interest rates, and home prices from 1985 through 2007. The data is slightly different, but the conclusion is largely the same. Today’s home prices are seriously out of whack with long-term trends.
Sources:
(Home Prices: see this post)
(Household Income: US Census Bureau)
(1950-1970 Interest Rates: Financial Forecast Center)
(1971-2007 Interest Rates: Federal Reserve)

