February stats from the NWMLS showed up even earlier than January. When the press release with pdf links is released I’ll post it here. Here is the summary along with the usual graphs and other updates.
Update: Here’s a link to the press release. I can’t help but laugh at the title: Northwest MLS Reports Pending Sales Increase 23 Percent from Month Ago. Apparently the market is so bad that the only way they can make it seem good is to compare month-to-month stats from what is traditionally the second-slowest month of the year. Awesome.
Here’s your King County SFH summary:
February 2008
Active Listings: up 61% YOY (yet another new record)
Pending Sales: down 32% YOY
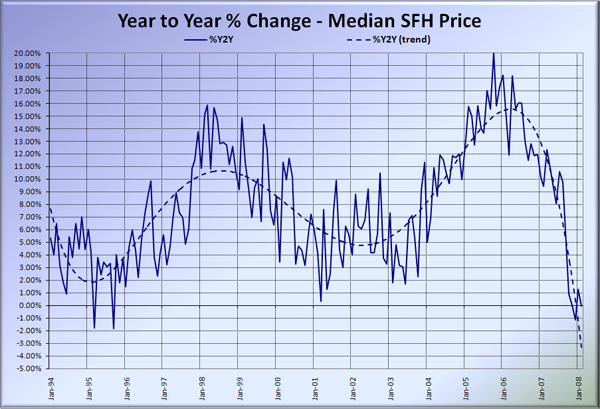
Median Closed Price*: $429,900 – down 0.01% YOY (basically flat)
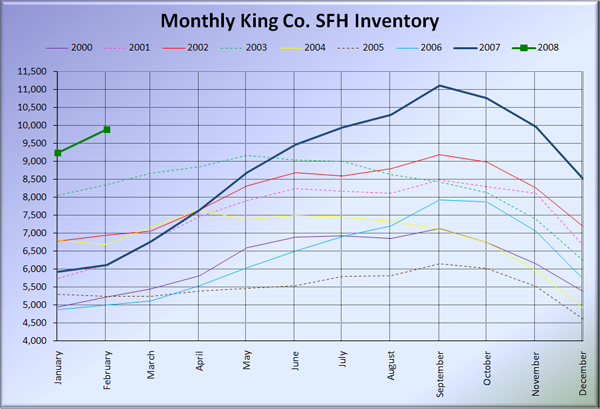
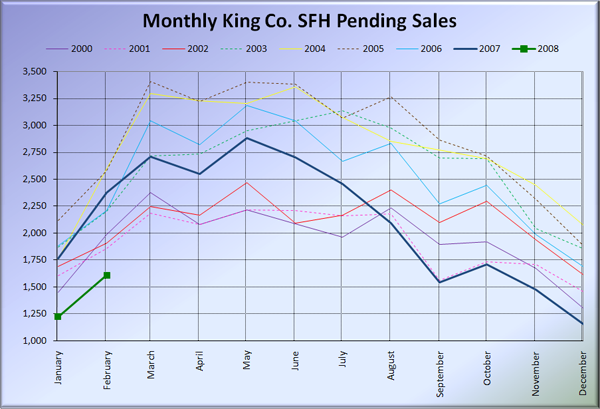
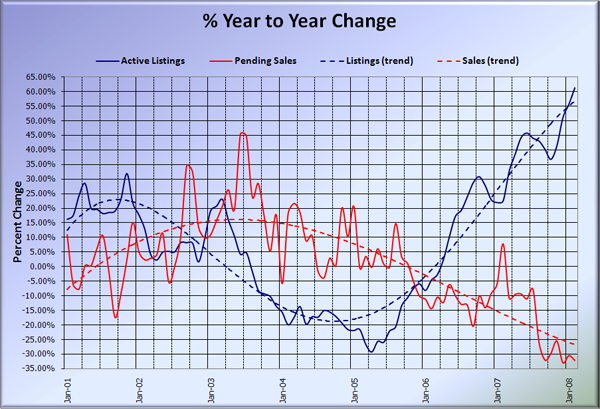
Despite the extra day in February this year, sales still continued to plummet, with the year-over-year drop nearly matching December’s -33% record. Listings continued to soar, setting yet another year-over-year record. Last year it took until July to have this many listings on the market. If the current pace keeps up, there will be over 17,000 single-family homes on the market in September. The Median price has been essentially flat since November, which if the trend continues will result in over 10% YOY negative by July.
Here is the updated Seattle Bubble Spreadsheet, and here’s a copy in Excel 2003 format. Click below for the graphs and the rest of the post.
The graph below shows inventory for each year overlaid on the same chart. Not only was February 61% over last year, it was also 18% higher than the previous February record of 8,358 set in 2003.
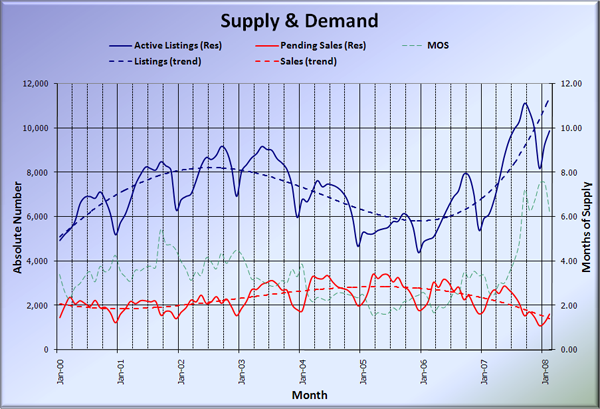
Despite the monthly ritual of positive quotes in the newspaper from local agents, sales continued their slide, coming in 32% below last year and 14% below the previous February low of 1,861 set in 2001. Despite the increase in listings and decrease in sales, months of supply dipped slightly, down to 6.14. However, that still makes February the sixth straight month of MOS above 6 (considered a buyer’s market).
Here’s the supply/demand YOY graph. Sure enough, I had to adjust the vertical scale to allow for the skyrocketing inventory. Sales didn’t quite dip low enough to have to adjust the lower bound yet.
Here’s the chart of supply and demand raw numbers:
Here’s the SFH Median YOY change graph. I took out the “smoothed line” option to better show the actual movement.
Here are excerpts from the blurbs from the Times and the P-I. Check back tomorrow for the reporting roundup.
Elizabeth Rhodes, Seattle Times: Housing inventory continues to swell in February
Newly released February home sales numbers reinforce the prevailing sense that the Puget Sound area is solidly a buyer’s market.
Despite excellent weather last month, a bumper crop of houses and condos to choose from and low interest rates, 36 percent fewer King County properties sold last month than the previous in February. However, compared to January, sales activity was up, with 421 more houses and condos selling.
Aubrey Cohen, Seattle P-I: Median home price up slightly in King County
Area real estate professionals proclaimed signs of a spring surge in February market statistics released Wednesday, but it may be too soon to definitively declare a rebound.
“In March, the real estate market is set to get its mojo back,” J. Lennox Scott, chairman and chief executive of John L. Scott Real Estate, said in a statement accompanying the new numbers from the Northwest Multiple Listing Service. “We’re already seeing the momentum build.”
Can I quote you on that, Lennox? Oops, I guess I just did.
