I was going to spread out the stats posts a bit, but since people have been asking for months of supply (a.k.a. “absorption rate”) data after yesterday’s inventory post, I’m posting it today. For an explanation of what months of supply means, please refer to the original neighborhood MOS breakdown post.
Keep in mind that we are considering below 6 MOS to be a sellers market and above 6 as a buyer’s market. Based on the sketchy pre-2000 data we have available, the longest that King County as a whole has sustained a MOS above 6 was 4-5 months in the winter of 1994-1995. With February’s 6.14 MOS, the current run is up to six months.
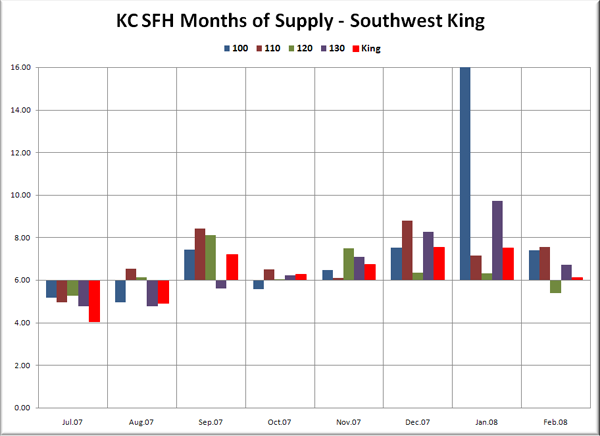
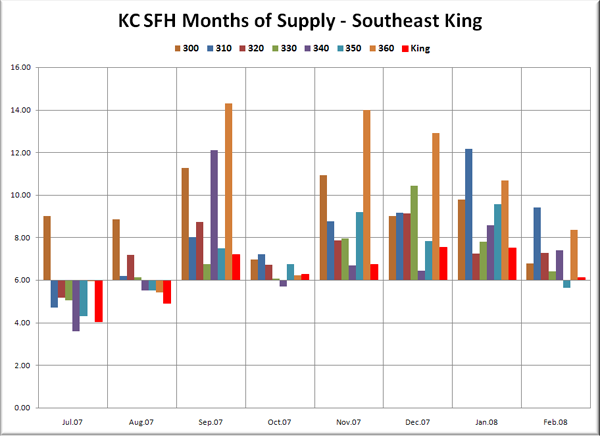
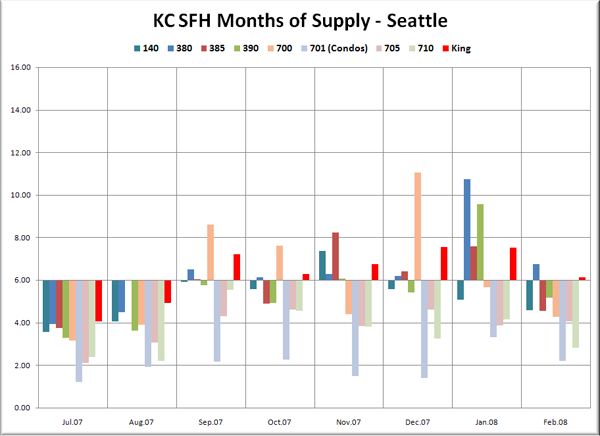
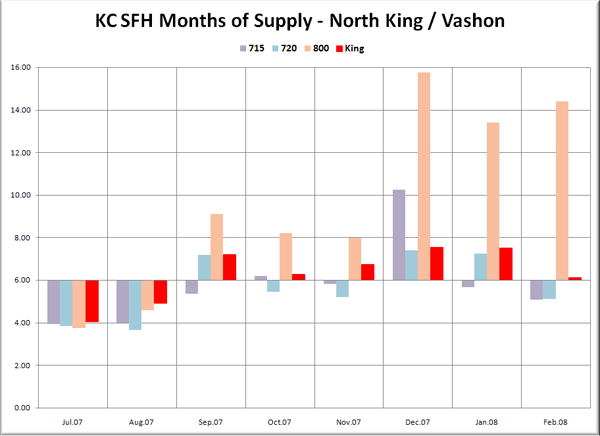
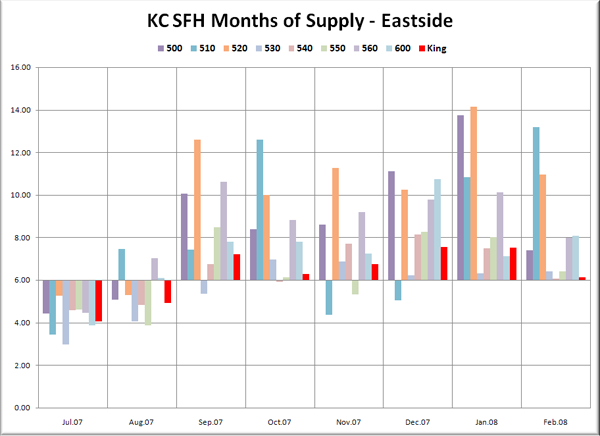
In the graphs below, you’re looking at the MOS for the “Res Only” data from the NWMLS King County Breakout pdfs for July 2007 through February 2008. The bar graph is centered vertically on 6.0 MOS, so that it is easier to visually tell the difference between a seller’s and buyer’s market (i.e. – shorter bars mean a more balanced market). Each graph again has the same scale on the vertical axis and has the King County aggregate figure plotted in red, so they can be easily compared.
For a description of which neighborhoods each area encompasses, as well as a map of the areas and a link to the source data, visit this page.
Note: Area 100 MOS was over 21 in January, and has been clipped.
Note: Area 701 (Downtown Seattle) has virtually zero SFH activity, so on a suggestion from a reader, I’m using condo data for this area.
Just like last month, the north Seattle neighborhoods in areas 705 and 710 (Ballard, Greenlake, Greenwood, Lake City, Northgate, Wedgewood, etc.) stick out as being considerably less friendly toward buyers than the county as a whole or any other individual area. With MOS of 4.05 in 705 and a dismal 2.81 in 710, now is still a good time to be selling in north Seattle. The condo situation downtown is also pretty lousy for buyers, with a MOS of 2.21, but I would take the condo statistics with a grain of salt, considering how many new construction condos never make it onto the MLS.
Only one neighborhood in Seattle proper is now still a buyer’s market, area 380, which is described by the NWMLS as “Central Seattle SE, Leshi, Mt Baker, Seward Park.” Most neighborhoods in south King County are still firmly in buyer’s market territory, MOS higher than the county aggregate in 9 of 11 areas. The Eastside continues to be harsh on sellers, with only one area coming in with a MOS slightly lower than the county as a whole, area 540 (east of Lake Sammamish) at 6.07 MOS.
Yesterday I pointed out that the Eastside areas 510, 520, and 530 all had some fairly extreme spikes in inventory. With 13.18 and 10.95 MOS, areas 510 and 520 are both firmly in buyer’s market territory, while area 530 is much less severe, but still more of a buyer’s market than the county as a whole at 6.41 MOS.
King County’s islands are the two worst places to be selling a home right now, with Vashon (800) coming in at 14.40 MOS and Mercer (510) close behind at 13.18.
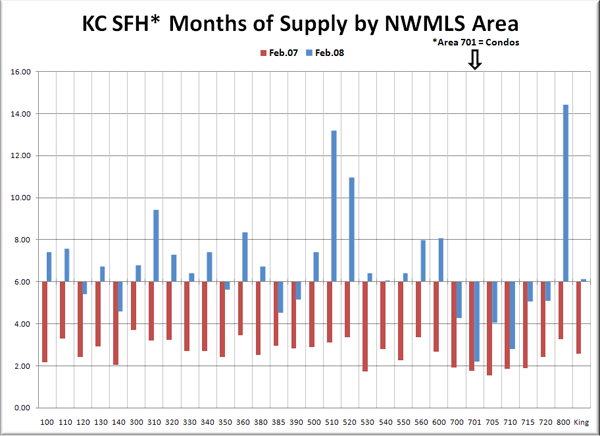
Here’s one more graph for you to chew on. In this one, you can directly compare each area’s MOS to one year ago’s value. February 2007 is in red, and 2008 is in blue.
There is not a single area that isn’t trending toward a buyer’s market compared to last year. In SFH, only one area had less than double last year’s MOS, area 710 (NE Seattle), which increased 53% from 1.84 to 2.81.
The three strongest areas as of last month were North Seattle (710) at 2.81, Ballard/Greenlake/Greenwood (705) at 4.05, and Queen Anne / Magnolia (700) at 4.28 (as well as Downtown condos (701) at 2.21). A few more areas dipped back into seller’s market territory last month, for a total of 11 out of 30 areas county-wide coming in below 6 MOS. The three weakest areas were Bellevue west of I-405 (520) at 10.95, Mercer Island (510) at 13.18, and Vashon Island (800) at 14.40.
