I think it’s a good time to revisit the median price discussion that I first brought up last August.
The median price is a decent indicator of the general direction of home prices, but it definitely has shortcomings. The biggest problem is that the median is largely influenced by the mix of sales between high and low-value houses. In a relatively stable housing market, when the mix stays somewhat constant, the median gives a fairly accurate picture of what’s going on with prices. However, when sales of houses on one end of the price spectrum begin to drop or increase at a rate considerably faster than other price tiers, the median gets all screwed up.
In order to investigate this phenomenon, we can break King County into three regions. For a more in-depth explanation of this breakdown, refer to the original median price post.
- low end: South King
- mid range: Seattle / North King / Vashon
- high end: Eastside
When we last checked in on this data, sales on the expensive Eastside had surged up, leading to a misleadingly high county-wide median price. Of course, that was July’s data, which was just before the tightening in the jumbo loan market. As you would expect, starting in September, sales in the predominantly jumbo Eastside market dropped back down to normal and below-normal levels.
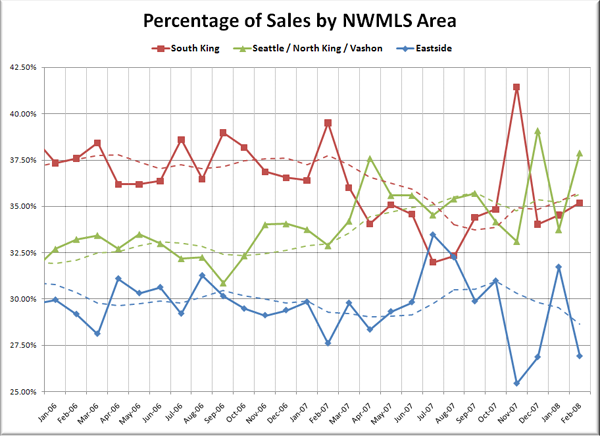
Here’s the chart showing the percentage of county-wide monthly sales that each of the three regions has accounted for since January 2006:

dashed line: 6 month rolling average | Click to enlarge
As a percentage of total county-wide sales, sales on the Eastside have dropped back down slightly, while sales in South King County have made a slight recovery from their lows of last summer. Meanwhile, Seattle continues to grab a larger and larger percentage of sales, as the slowdown hits the outlying areas first (this can be observed in the neighborhood breakdown posts as well).
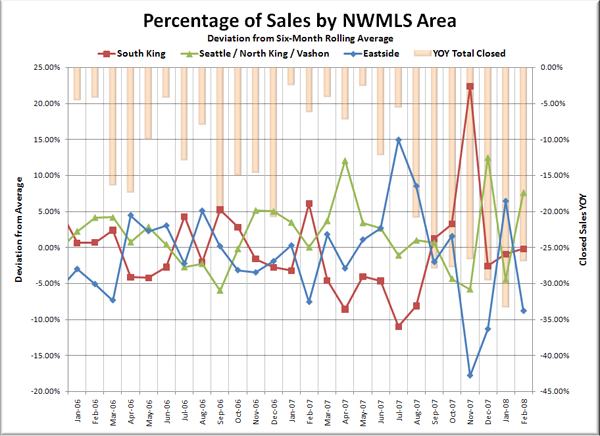
You can also see that in recent months, there are a lot more dramatic spikes in the graph, as the mix of sales fluctuates somewhat rapidly. Here’s a graph showing how far each region is deviating each month from its average share over the last six months:
I added the total YOY sales as a bar graph referenced to the right axis to demonstrate how much the declining sales volumes overall seems to be influencing the severe swings in the sales mix. As the decline in sales becomes more severe, the mix is more volatile, which leads to a less meaningful median price.
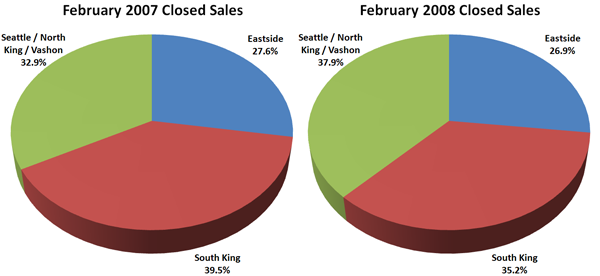
Here’s one more visual example of the problem with the median. The pie charts below show the breakdown in sales in February 2007 and February 2008.
In February 2007 the median price was $429,925, and was calculated from a pool of roughly 28% Eastside, 33% Seattle / N. King, and 39% S. King. In February 2008, the median price was virtually unchanged at $429,900, but the pool was noticeably changed to 27% Eastside, 38% Seattle / N. King, and 35% S. King. The Eastside made up nearly the same amount of the mix, but sales in low-priced South King County dropped faster than in Seattle, leading to an increase of five percentage points in Seattle’s share of the mix.
I point all this out just to remind readers that the median price is deceiving. Most likely, the price of homes in most parts of King County was not flat from February 2007 to February 2008 as the median price suggests, but was actually dropping. However, with Seattle making up a larger percentage of the total homes sold, that fact is being masked.
Unfortunately, looking at median prices for individual NWMLS areas (like we do for months of supply and inventory) wouldn’t be very instructive, since most areas have such a small number of sales and the median tends to fluctuate pretty wildly. The only real way to get around this problem is to look at resales of the same houses, and compare the price to the previously sold price. This is of course exactly what the Case-Shiller Home Price Index does, and again, I believe that February’s Case-Shiller data will indeed show a larger YOY decrease than the median. I’m predicting it will show around -2% YOY.
The bottom line here is that median prices are moderately useful as a broad gauge of market direction, but you shouldn’t put too much stock in the specific numbers.

