Here’s an update to the NWMLS statistics for all six Puget Sound counties. I don’t personally want to live in King County, and maybe you don’t either. So, here’s a little graphical look at what the market looks like around the sound.
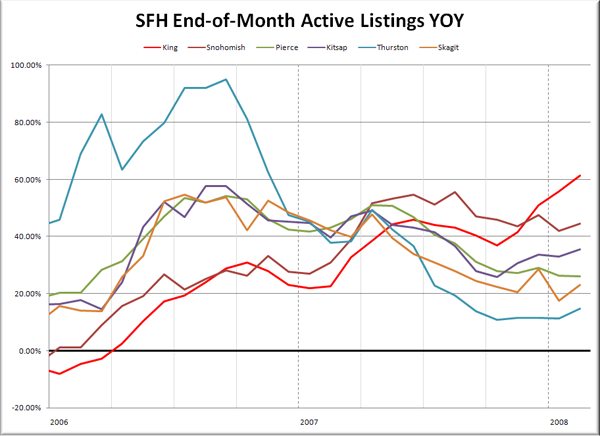
Here’s where each of the six counties stand as of February 2008:
King – Price: -0.0% | Listings: +61.3% | Sales: -32.3% | MOS: 6.1
Snohomish – Price: -0.3% | Listings: +44.5% | Sales: -36.3% | MOS: 7.4
Pierce – Price: -7.4% | Listings: +26.0% | Sales: -28.2% | MOS: 8.6
Kitsap – Price: -12.3% | Listings: +35.5% | Sales: -35.2% | MOS: 9.7
Thurston – Price: +2.0% | Listings: +14.8% | Sales: -17.7% | MOS: 6.0
Skagit – Price: +9.2% | Listings: +23.2% | Sales: -20.6% | MOS: 8.4
Following below are updates to the seven graphs I introduced with January’s data earlier this month. Click below to continue reading.
I’ve dialed the x-axis down from last month on most of these to show just the time period since January 2006, to hopefully provide less busy graphs. If you want to see the long-term trends, feel free to download the spreadsheet (or in Excel 2003 format) that all of these graphs come from, and adjust the x-axis to your liking.
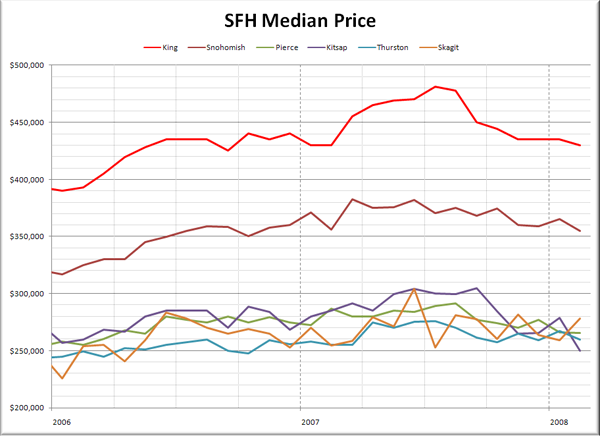
First up, let’s have a look at raw median prices.
Five out of the six Puget Sound counties continued their declines last month, with the especially volatile Skagit County posting a month-to-month increase and a 9% year to year increase. Given that Skagit has the lowest volume of closed sales of any of the counties, fluctuations like this are expected.
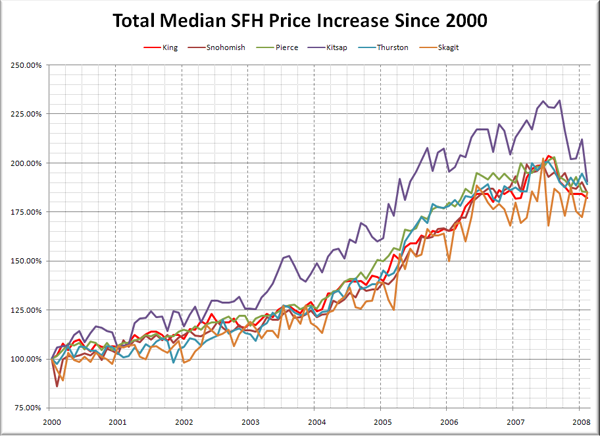
Here’s the chart showing the total percent increase since January 2000 for each of the six counties.
Wow, Kitsap sure came crashing back down to earth quickly. In just five months, the median price in Kitsap has gone from 232% of its January 2000 value to 190%. For those of you keeping score at home, here’s how each of the counties look compared to their peak:
King – Peak: July 2007 | Down 11%
Snohomish – Peak: March 2007 | Down 7%
Pierce – Peak: August 2007 | Down 8%
Kitsap – Peak: September 2007 | Down 18%
Thurston – Peak: July 2007 | Down 6%
Skagit – Peak: June 2007 | Down 8%
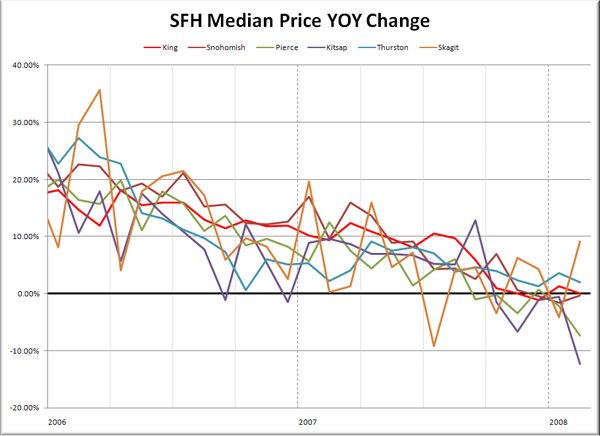
Here’s the third take on median prices, looking at YOY changes.
At the moment, it looks like Pierce and Kitsap are feeling the pinch the worst, but the trend is abundantly clear for all six counties.
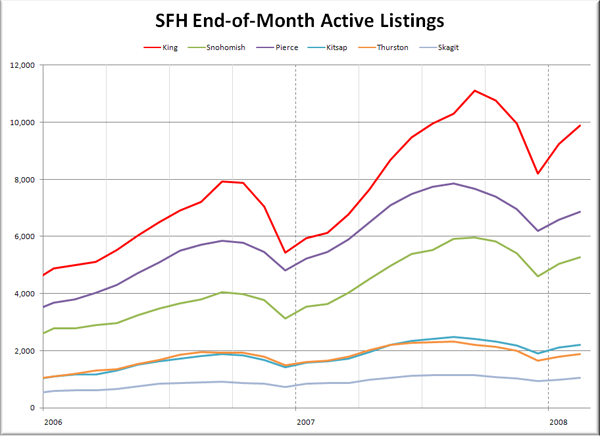
Moving on to listings:
All six counties look to be rapidly approaching their September inventory highs, and the spring selling season hasn’t even begun yet.
Here’s a look at the YOY change in listings.
The smallest number for February was Thurston County at 15% YOY inventory growth. King County leads the pack with its 62% increase, piling on more and more inventory as the months go by.
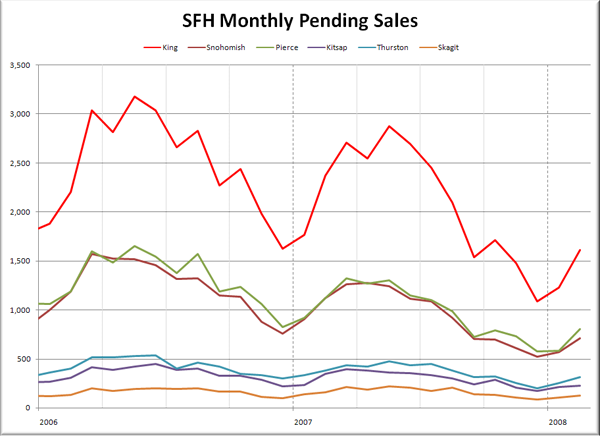
Lastly, let’s check out pending sales:
Sales across the sound had their usual post-holiday bump in February. There really won’t be much to look at on here until we get further along in the year. Most counties tend to have their peak number of sales in the spring months of March-May, so the next few months will really give us a clear picture of how much we’ve slowed down.
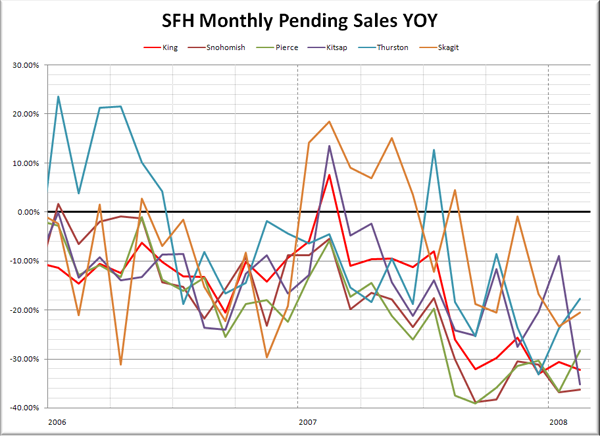
Lastly, here’s the YOY graph of sales:
Still a pretty sorry picture in February when you compare it to last year. No county did better than a 17% drop in sales. Snohomish brings up the rear with a big 36% drop from last February.
The picture I’m getting from looking at these is that the biggest price weakness is in the furthest outlying counties, but with the way inventory is piling up and sales are dropping in King and Snohomish, they could easily catch up with their neighbors soon.
