Home prices in Seattle continue to decline, at an increasing rate, according to the latest data from the Case-Shiller Home Price Index.
Down 1.76% December to January.
Down 1.25% YOY.
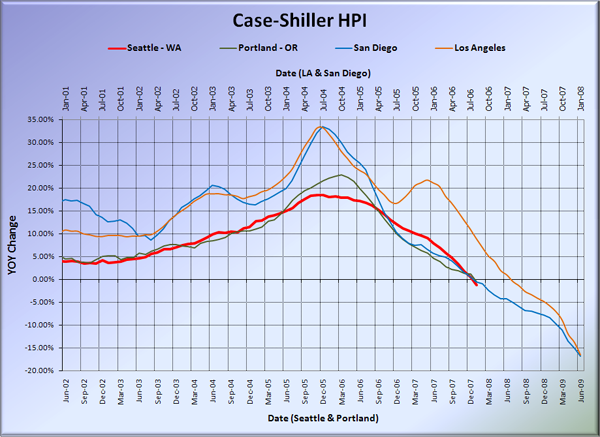
In a big surprise to absolutely no one, Seattle is now officially in the realm of year-to-year price declines. What a change from just one year ago, when prices were up 11.14% year-over-year. It only took six months of declines from the peak to get here. Home prices in Seattle have now declined a total of 5.55% from their July 2007 peak.
Here’s the usual graph, with L.A. & San Diego offset from Seattle & Portland by 17 months. Despite a sharp drop down in Portland, Seattle’s YOY is still slightly worse than our neighbors to the south.
Also, here’s an interesting coincidence: The total time from peak year-over-year appreciation to year-over-year depreciation in Seattle came in at 25 months. Most cities went negative quicker than that (Detroit was the fastest at 11 months), but two cities took longer, Minneapolis and Las Vegas. One city took exactly as long as Seattle. I bet you can guess which one… San Diego. Heh.
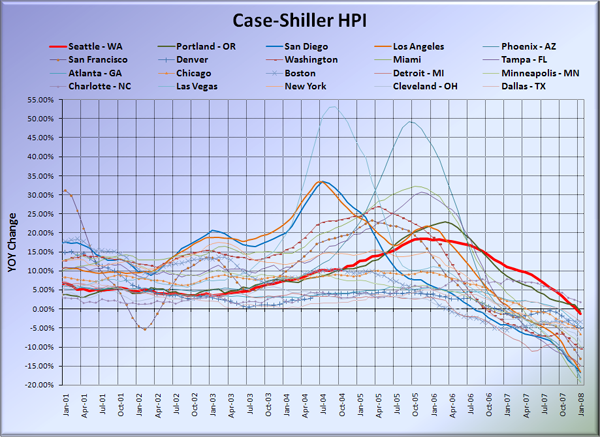
And here’s the graph of all twenty Case-Shiller-tracked cities:
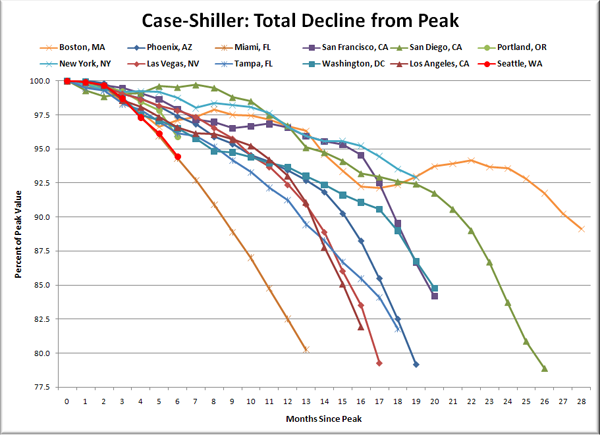
Here’s an update to the peak-decline graph I posted last month, inspired by a graph created by reader CrystalBall. This chart takes the twelve cities whose peak index was greater than 175, and tracks how far they have fallen so far from their peak. The horizontal axis shows total months since each individual city peaked.
I don’t think anyone would have guessed that for the first six months on the way down, the city we would follow the closest would be Miami. Yow. But don’t anybody worry, I’m sure the bottom is in. Just like it has been for each of the last twelve consecutive months.
Check back tomorrow for a post on the Case-Shiller data for Seattle’s price tiers.
(Home Price Indices, Standard & Poor’s, 03.25.2008)


