Let’s check in on the NWMLS statistics from around the sound. I realized this month that if I’m going to include Skagit County in the Puget Sound wrapup, I should probably include Island County as well. So from now on we’re looking at seven Puget Sound counties. I’d change the name of the site to “PugetSoundBubble.com,” but I wouldn’t want to sacrifice the name recognition we’ve built up over the last few years. Anyway, here’s a little graphical look at what the market looks like around the sound.
Here’s where the YOY stats stand for each of the six counties as of April 2008:
King – Price: -3.6% | Listings: +49.4% | Sales: -27.8% | MOS: 6.2
Snohomish – Price: -6.7% | Listings: +27.7% | Sales: -42.9% | MOS: 7.9
Pierce – Price: -3.6% | Listings: +13.1% | Sales: -26.3% | MOS: 7.9
Kitsap – Price: -4.4% | Listings: +24.0% | Sales: -34.8% | MOS: 9.8
Thurston – Price: -2.7% | Listings: +0.9% | Sales: -17.1% | MOS: 5.9
Island – Price: -13.5% | Listings: +24.4% | Sales: -30.6% | MOS: 12.1
Skagit – Price: -6.5% | Listings: +20.8% | Sales: -31.7% | MOS: 9.3
Following below are the graphs you’ve come to expect. Click below to continue reading.
These graphs only represent the market action since January 2006. If you want to see the long-term trends, feel free to download the spreadsheet (or in Excel 2003 format) that all of these graphs come from, and adjust the x-axis to your liking. Also included in the spreadsheet is data for Whatcom County, for anyone up north that might be interested.
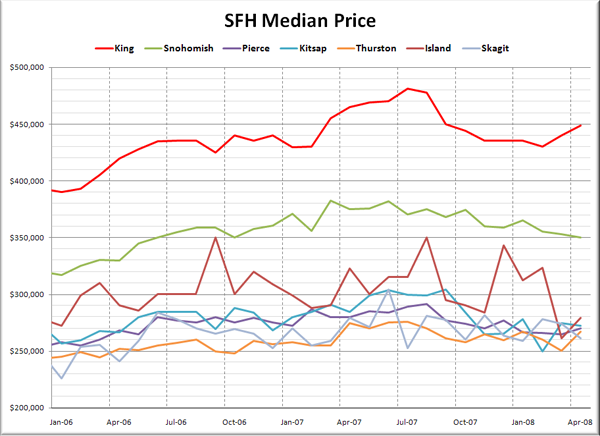
First up, it’s raw median prices.
Prices were up month-over-month in King, Pierce, Thurston, and Island, and down in Snohomish, Kitsap, and Skagit. This is more likely to be a little seasonal bump than an indication that prices in these counties have hit bottom.
Here’s how each of the counties look compared to their peak:
King – Peak: July 2007 | Down 7%
Snohomish – Peak: March 2007 | Down 9%
Pierce – Peak: August 2007 | Down 7%
Kitsap – Peak: September 2007 | Down 11%
Thurston – Peak: July 2007 | Down 3%
Island – Peak: August 2007 | Down 20%
Skagit – Peak: June 2007 | Down 14%
The total declines are diverging a bit, as some counties experience the spring bump, and others continue to decline. Island County is getting totally hammered, with April’s median at $279k vs. the August ’07 peak of $350k. Of course, it’s difficult to draw any strong conclusions from that data, since they have had less than 100 closed sales each of the last seven months.
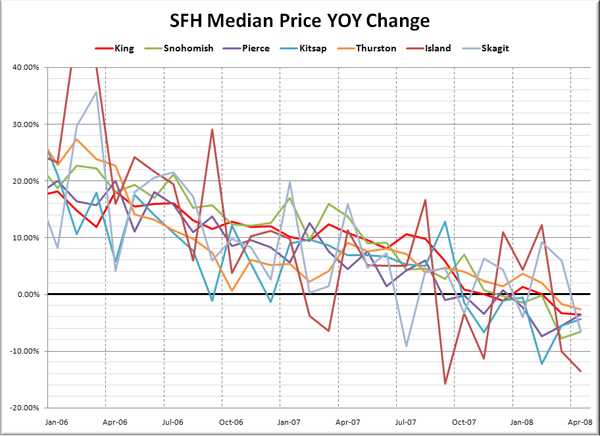
Here’s another take on Median Prices, looking at the year-to-year changes over the last two years.
Island, Snohomish, and Skagit Counties are all racking up losses in excess of 6% YOY, with everyone else dropping between two and four percent.
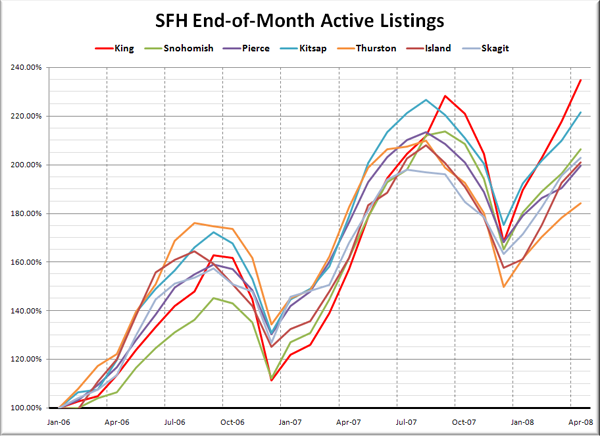
Here’s the graph of listings for each county, indexed to January 2006.
Pretty much the same picture as last month, with King County leading the pack, and Thurston taking up the rear. So far King and Skagit are the only counties that exceeded last year’s peak inventory in April.
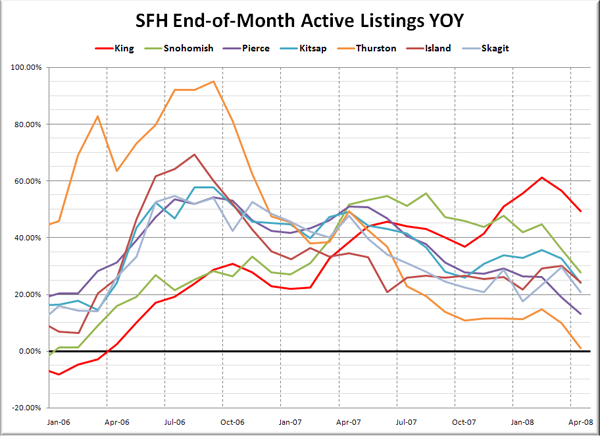
Here’s a look at the YOY change in listings.
Every county had more inventory than the year before, but the rate of buildup is slowing across the board.
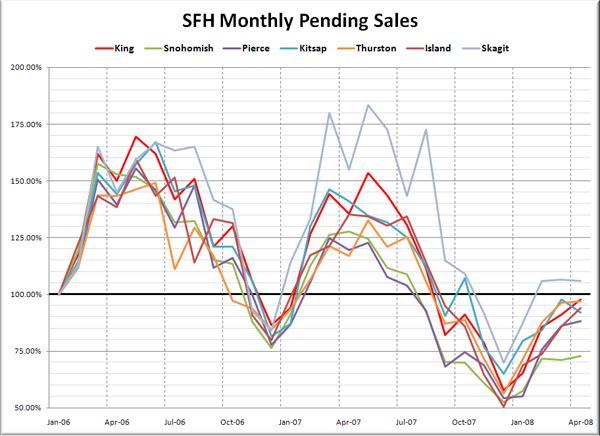
Lastly, let’s check out pending sales, also indexed to January 2006.
Sales in Snohomish County continue to be absolutely anemic. What is going on up there?
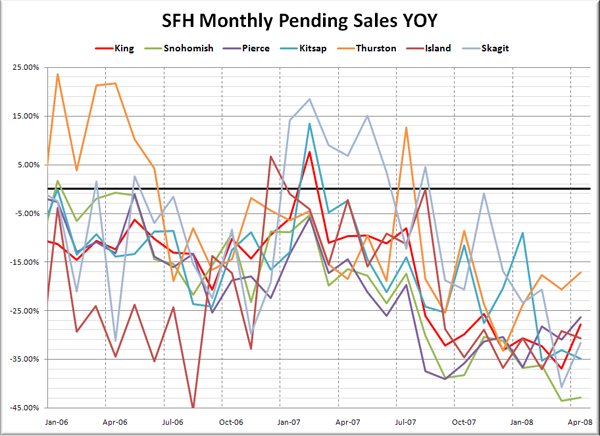
Lastly, here’s the YOY graph of sales:
Every county around the Sound is having serious trouble finding buyers, with pending sales dropping 17% YOY on the low end in Thurston and 43% on the high end in Snohomish.
I’m surprised that Snohomish is getting hammered so hard on sales, worse than Skagit or Thurston even. The data from Island County is pretty much what you’d expect, what with the increasing price of gas and ferry trips. Overall, things seem to still be on the decline across the board.
