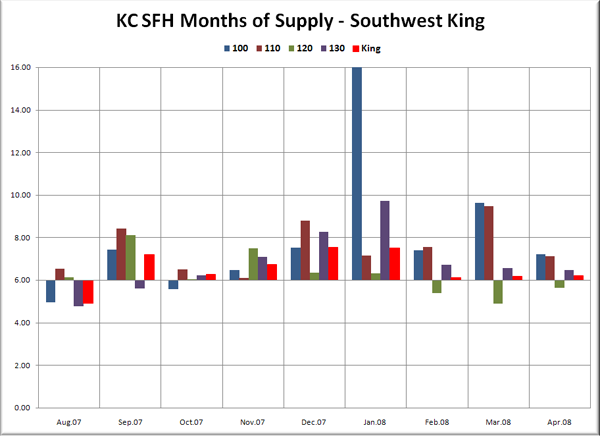
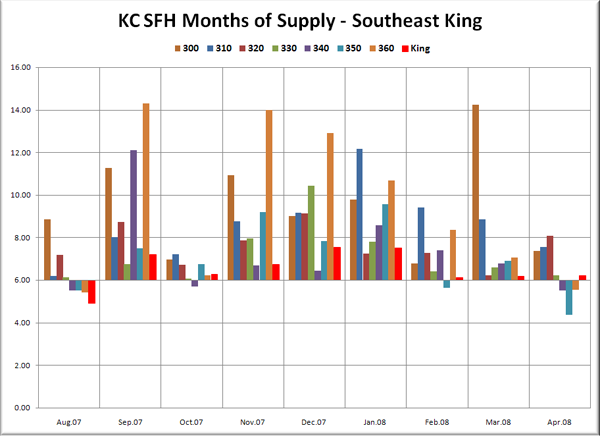
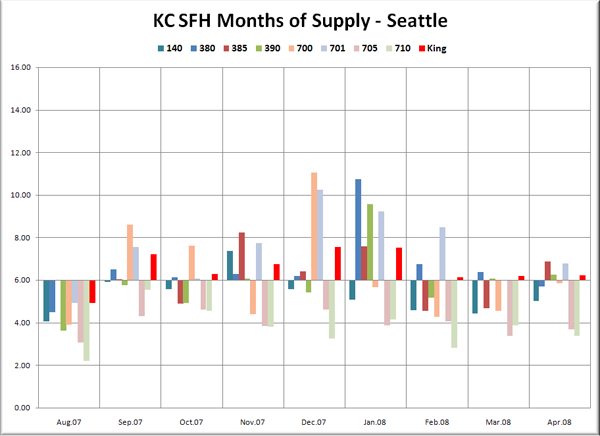
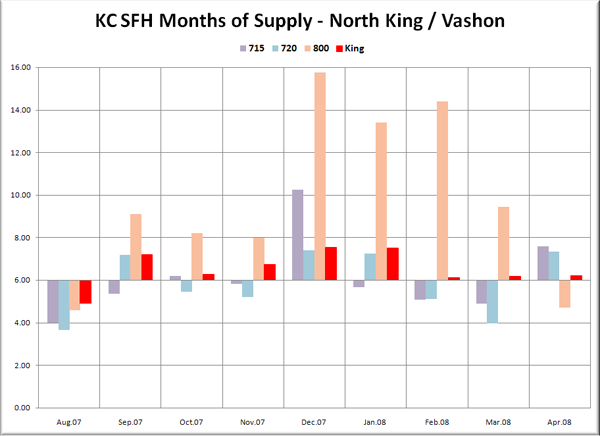
Here’s the latest update on months of supply, or “absorption rates” for the 30 NWMLS areas in King County. For an explanation of what months of supply means, please refer to the original neighborhood MOS breakdown post.
Remember: Over 6 MOS is a buyer’s market, which gives buyers more negotiating power, but doesn’t mean homes are priced attractively for buyers or that it’s a good time to buy. Before this year, the longest that King County as a whole has sustained a MOS above 6 was 4-5 months in the winter of 1994-1995. April MOS for King County came in at 6.21 (up slightly from March), bringing the current run to eight months. In seven of the last eight years, March has been the low point for MOS (2003 was the exception, when MOS bottomed in July). It seems unlikely that the county-wide MOS will drop back below six this year.
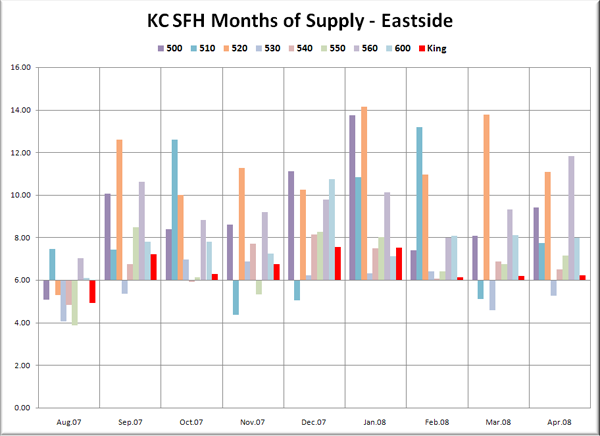
In the graphs below, you’re looking at the MOS for the “Res Only” data from the NWMLS King County Breakout pdfs for the nine-month period of July 2007 through March 2008. The bar graph is centered vertically on 6.0 MOS, so that it is easier to visually tell the difference between a seller’s and buyer’s market (i.e. – shorter bars mean a more balanced market). Each graph again has the same scale on the vertical axis and has the King County aggregate figure plotted in red, so they can be easily compared.
For a description of which neighborhoods each area encompasses, as well as a map of the areas and a link to the source data, visit this page.
Note: Area 100 MOS was over 21 in January, and has been clipped.
Note: For Area 701 (Downtown Seattle) we’re using condo data.
The best markets for sellers are yet again found in North Seattle areas 705 and 710 (Ballard, Greenlake, Greenwood, Lake City, Northgate, Wedgewood, etc.), with 3.68 and 3.39 MOS respectively. No other areas were below 4 MOS, but 9 more areas fell between 4 and 6 MOS (weak sellers markets). The Seattle city limits as a whole continue to be a bad place to be buying a home, with a collective MOS of just 4.84. Seattle continues to trend toward a buyer’s market though, with MOS up from 4.54 last month, and this April having over twice as many months of supply as last April, which had just 2.18 MOS.
I discovered an error in my spreadsheet for the downtown condo market, where I had been recording only new listings instead of total listings, which as you can see in the Seattle graph, makes quite a difference. The downtown condo market is clearly a buyer’s market at 6.79 MOS, but it’s down considerably from the peak in December, when there was over ten months of supply.
A few more south King County neighborhoods slipped back into seller’s market territory, but seven of eleven still came in with MOS higher than the county aggregate. Despite/due to having some of the region’s highest prices, the Eastside is still a lousy place to be trying to sell a home right now, with a collective MOS of 7.78 (up from 7.38 in March), and 7 of 8 areas coming in with MOS above the county as a whole. Area 530 (East Bellevue, West Redmond) is the only Eastside holdout for sellers, with an MOS of 5.25 (up from 4.59 in March).
All three of the best markets for buyers were on the Eastside: Area 500 (East Side–South of I-90), 520 (Medina, Clyde Hill, W. Bellevue), and 560 (Kirkland–Bridle Trails). With 11.07 MOS, Area 520 (Medina, Clyde Hill, W. Bellevue) continues to hold the dubious distinction of having the longest-running 10+ MOS streak, now in its eighth month.
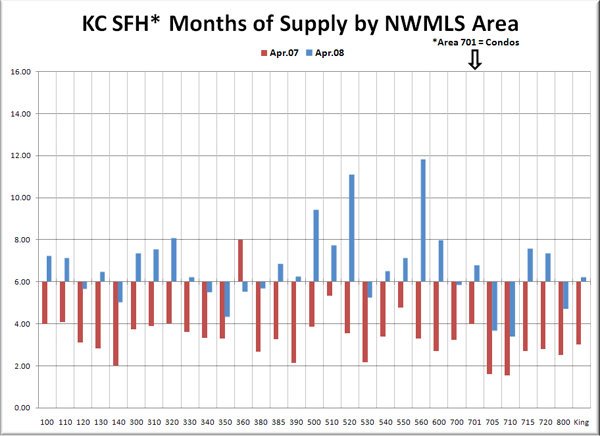
Here’s the bonus graph, which lets you directly compare each area’s MOS to one year ago’s value. April 2007 is in red, and 2008 is in blue.
Whoa now, what’s going on in area 360? Last year it had 8.0 MOS, and this year it’s dropped to 5.5? Quite odd, but when there are never more than a few dozen sales each month, it’s not too surprising to see strange swings like that. This is why I generally prefer to look at county-wide data to assess overall trends. More data means its less suceptible to bizarre bounces. Other than area 360, every other area was more of a buyer’s market in April than it was at this time last year.
The three best markets for sellers as of last month were North Seattle (710) at 3.39, Ballard/Greenlake/Greenwood (705) at 3.68, and Renton Highlands/Kennydale (350) at 4.35. 11 out of 30 areas county-wide came in below 6 MOS. The three best markets for buyers were Kirkland–Bridle Trails (560) at 11.81, Medina/Clyde Hill/W. Bellevue (520) at 11.07, and the East Side South of I-90 (500) at 9.40.
