I have now been tracking the Distressed Sellers Index for a full year, and since I haven’t mentioned it on here since way back in October, I thought it now would be a good time for another update.
Please keep in mind that I do not claim the DSI to be in any way scientific or statistically rigorous, but rather I provide it as a point of general interest. It uses an original and proprietary algorithm to measure the ratio of listings using “distressed language” compared to the total number of listings.
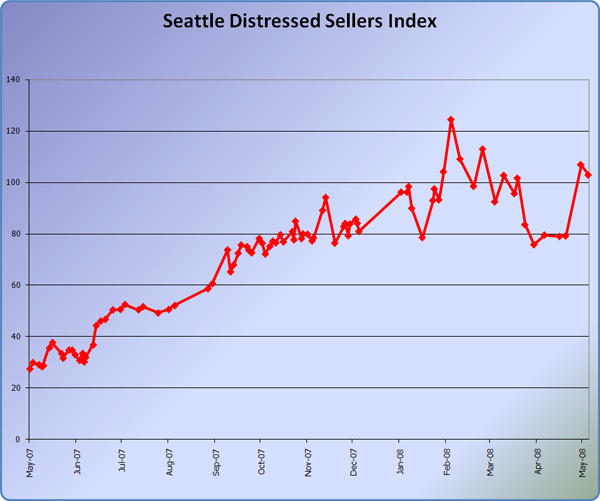
Here’s a graph of one full year of the DSI:
Last May the DSI was in the upper 20s. This May it has bounced up to over 100, with the latest update coming in at 103. You can also see above that February and March had a series of particularly high points on the index, and it appeared to be heading back down to the upper 70s until the last few updates.
Again: I’m not attempting to apply any sort of predictive meaning to these values. They’re provided as a curiosity, nothing more.
For the sake of comparison, here are the current DSI values for select additional cities:
- Boston: 77
- Detroit: 96
- Las Vegas: 222
- Sacramento: 150
- Miami: 212
- San Diego: 209
- Los Angeles: 168
- Phoenix: 162
Most of the other cities fall more or less in line with where you would expect based on the condition of their respective housing markets, with the notable exceptions of Boston and Detroit (down 12% and 23% from their respective peaks). My guess as to what’s going on there would be that most sellers in those cities have managed to make it all the way through the five stages of grief and since they’re now accepting the falling prices situation, they don’t tend to use distressed language in their listings.
Anyway, there you go. If this index is interesting to enough people, I can make it into a regular monthly post. Otherwise it will remain just an occasional curiosity.
