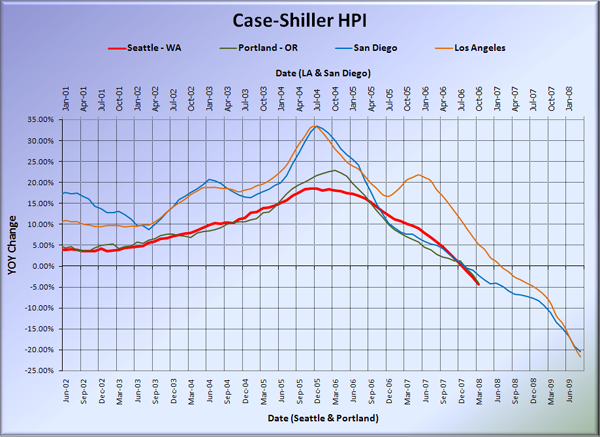
The March Case-Shiller Home Price Index came in fairly close to, but slightly worse than the NWMLS statistics for the same month.
Down 0.9% February to March.
Down 4.4% YOY.
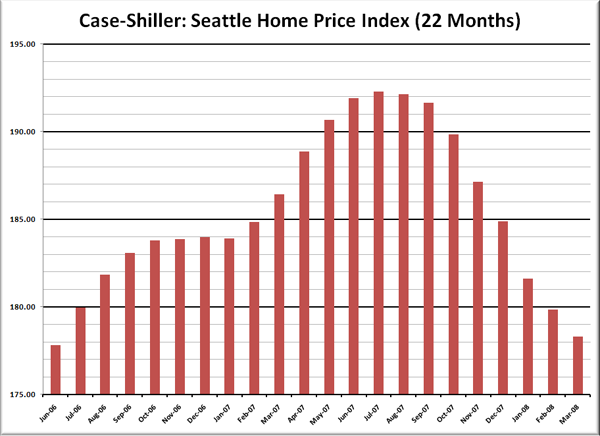
According to Case-Shiller, home prices in Seattle have now declined a total of 7.3% from their July 2007 peak, and have retreated to just above where they were in June 2006.
In related news, if you are looking for a laugh, check out this recent column over at Inman News: Put a gag on Chicken Little. In it, the author actually tries to argue with a straight face that Case-Shiller is the least accurate gauge of home prices. Her “logic” is centered on the fact that data from Case-Shiller shows larger price drops than indices from OFHEO (which includes refinancing and only conforming loans), the NAR (you know how trustworthy they have proven themselves to be), and Realogy (parent company of Century 21, ERA, Coldwell Banker, and Sotheby’s International Realty—definitely no bias there, either), so obviously Case-Shiller must be incorrect. Heh.
Here’s the usual graph, with L.A. & San Diego offset from Seattle & Portland by 17 months. Portland’s YOY drops nearly caught up with Seattle in March, coming in just over 4% to Seattle’s 4.4%. The vertical axis on most of these graphs had to be expanded, due to the continued declines in cities such as San Diego and Miami, now topping 20% YOY, and 25% total decline from the peak (with still no sign of slowing).
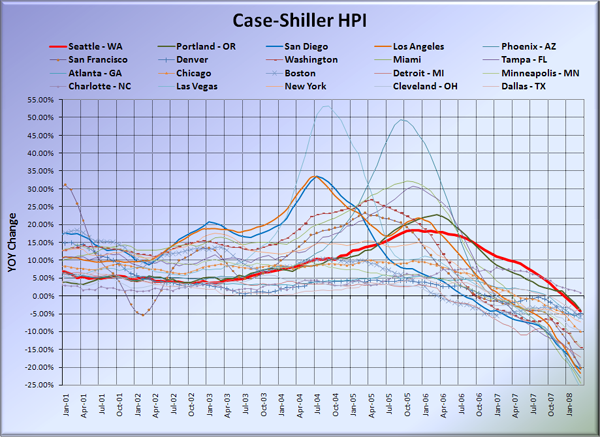
And here’s the graph of all twenty Case-Shiller-tracked cities:
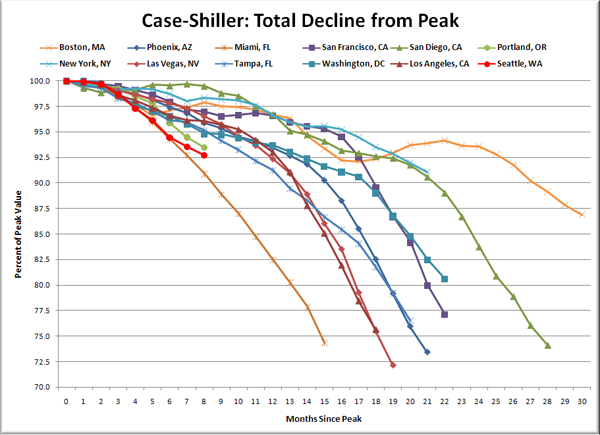
Here’s an update to the peak-decline graph, inspired by a graph created by reader CrystalBall. This chart takes the twelve cities whose peak index was greater than 175, and tracks how far they have fallen so far from their peak. The horizontal axis shows the total number of months since each individual city peaked.
8 months into home price declines, Seattle has shed 7.3% off the peak. At this point in San Diego’s decline, prices were down a whopping 0.5%, San Francisco was down about 3%. They have now seen a total decline of 26% and 23%, respectively.
Here’s the “rewind” chart I introduced last month. The horizontal range is selected to go back just far enough to find the last time that Seattle’s HPI was as low as it is now. This gives us a clean visual of just how far back prices have retreated in terms of months.
Prices have been rewound approximately 21 months to June 2006. In the 8 months since Seattle’s peak prices, 13 months of price gains have been wiped out.
One thing I hear a lot is that price drops will never get as “bad” here as they will in Florida or California. I agree with that assertion. However, even if we take that as a given, we won’t really know anything about where Seattle’s bottom will be until we finally see a bottom in Florida and California. San Diego and Miami are down 26% so far, but who is to say they won’t continue dropping until they reach 50% off? They’re certainly not showing any sign of leveling off any time soon. If that were to happen, prices in Seattle could drop “only” 35-40% (which would put us at 2003 prices) and still not be as “bad” as Florida or California. A scenario like that seems entirely plausible to me.
Check back tomorrow for a post on the Case-Shiller data for Seattle’s price tiers.
(Home Price Indices, Standard & Poor’s, 05.27.2008)
Update: Here’s the Aubrey Cohen’s P-I story on the data. Apparently Elizabeth Rhodes at the Times is too busy today to do anything more than add a single sentence to the AP story.


