Let’s check in on the NWMLS statistics from around the sound and see if the bottom is in yet for any of the seven Puget Sound counties we’re tracking.
Here’s where the YOY stats stand for each of the six counties as of May 2008:
King – Price: -6.2% | Listings: +41.7% | Sales: -38.7% | MOS: 7.0
Snohomish – Price: -6.9% | Listings: +22.4% | Sales: -44.7% | MOS: 8.9
Pierce – Price: -6.7% | Listings: +7.3% | Sales: -33.1% | MOS: 8.7
Kitsap – Price: -11.3% | Listings: +14.7% | Sales: -34.3% | MOS: 10.5
Thurston – Price: -1.8% | Listings: -2.6% | Sales: -28.5% | MOS: 6.3
Island – Price: +1.7% | Listings: +14.2% | Sales: -34.6% | MOS: 13.4
Skagit – Price: +3.1% | Listings: +14.7% | Sales: -40.9% | MOS: 9.3
Following below are the graphs you’ve come to expect. Click below to continue reading.
These graphs only represent the market action since January 2006. If you want to see the long-term trends, feel free to download the spreadsheet (or in Excel 2003 format) that all of these graphs come from, and adjust the x-axis to your liking. Also included in the spreadsheet is data for Whatcom County, for anyone up north that might be interested.
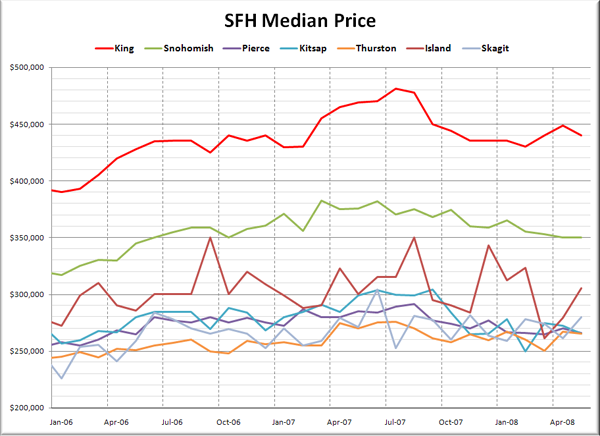
First up, it’s raw median prices.
Prices were up month-over-month in the Skagit and the ever-volitile Island County, flat in Snohomish, and down everywhere else. With sales dropping through the floor like they have been lately, real price changes are likely being somewhat masked across the board by a change in the mix of homes sold.
Here’s how each of the counties look compared to their peak:
King – Peak: July 2007 | Down 9%
Snohomish – Peak: March 2007 | Down 9%
Pierce – Peak: August 2007 | Down 9%
Kitsap – Peak: September 2007 | Down 13%
Thurston – Peak: July 2007 | Down 4%
Island – Peak: August 2007 | Down 13%
Skagit – Peak: June 2007 | Down 8%
Despite the supposed strength of the “core” markets of Seattle and Bellevue in King County, so far Thurston County holds the prize for the smallest decline.
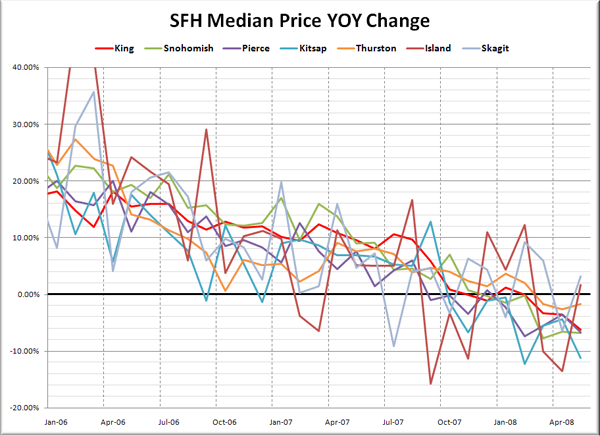
Here’s another take on Median Prices, looking at the year-to-year changes over the last two years.
Island and Skagit Counties shot into positive YOY territory, most likely due more to the paltry number of sales (less than 200 total between them) than any sort of recovery.
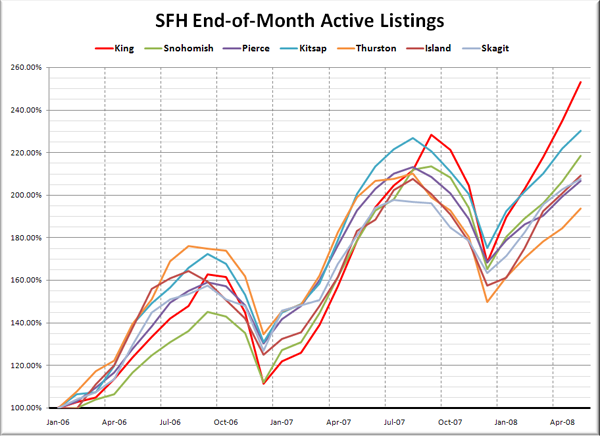
Here’s the graph of listings for each county, indexed to January 2006.
King, Snohomish, Kitsap, Island, and Skagit counties have all exceeded their 2007 peak inventories as of May. Pierce lags a bit behind, and inventory accumulation in Thurston is speeding up, but still lags far behind everywhere else for some reason.
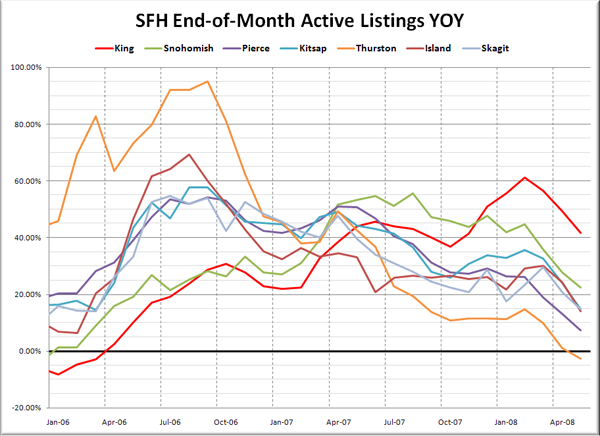
Here’s a look at the YOY change in listings.
Looks like inventory growth down in Thurston peaked back in 2006, as the May 2008 value actually came in lower than 2007. Growth in the other counties ranged between 7.3% in Pierce and 42.7% in King.
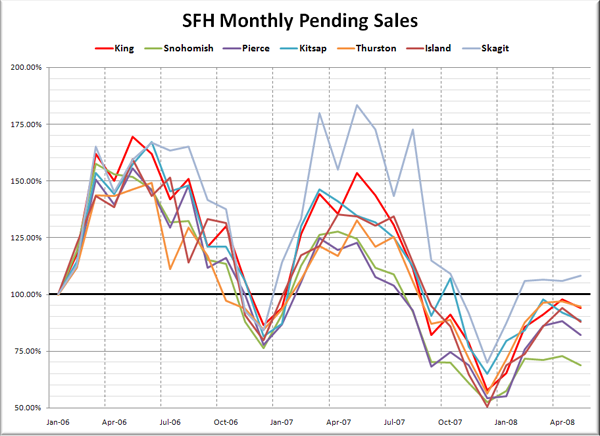
Lastly, let’s check out pending sales, also indexed to January 2006.
Sales in Snohomish County still came in far worse than everywhere else. Also worth noting: six of the seven counties had fewer sales in May 2008 than they did in January 2006, the slowest month of the year. May is quite often the high point for sales in a given year.
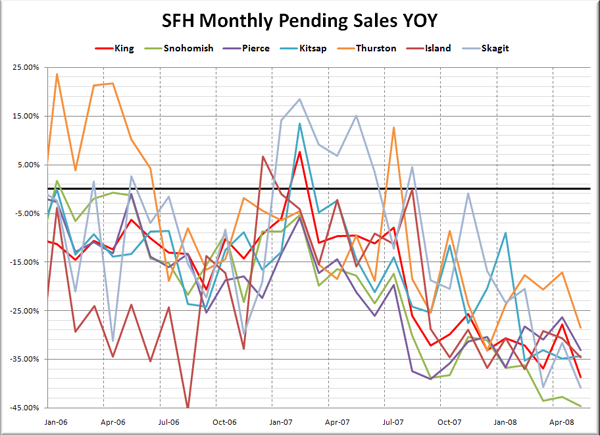
Lastly, here’s the YOY graph of sales:
That’s a pretty severe drop in pretty much every county but Kitsap. Sales declines ranged from a 45% drop in Snohomish to 29% off in Thurston.
Snohomish County seems to still be the big loser around the sound, volume-wise, while the smaller, more remote Kitsap and Island counties lead the way in price drops. The most interesting thing to me is the apparent inventory recovery down in Thurston. What’s going on down there?
