I received a question recently from a reader that can basically be boiled down to “does record-high inventory really equate to the ‘larger selection’ that real estate agents have been touting recently?” Here is their reasoning for asking:
Let’s say (just making numbers up here) that during the boom years 10 houses with your parameters come on the market every week and stay there for two weeks before becoming pending sales. On average there are 20 houses available at any given time. Now let’s say during the pop sellers don’t like what they are seeing and decide now isn’t such a great time to upgrade after all. Now, only 5 houses with your parameters are coming on the market every week and they just sit there. Suddenly, the average number on the market sky rockets.
After a month, your 20 house baseline has doubled. But do you really have a better selection? Sure, you will get less competition if you want to make an offer. And, if you fly out to visit and have to buy this weekend, there is more to choose from. But, if you are taking your time and have a span of months over which to shop – fewer houses have come on the market so you actually have a poorer selection.
In order to investigate this, I went back to the inventory analysis methods that Deejayoh pioneered in his February post “What happens to listings?“
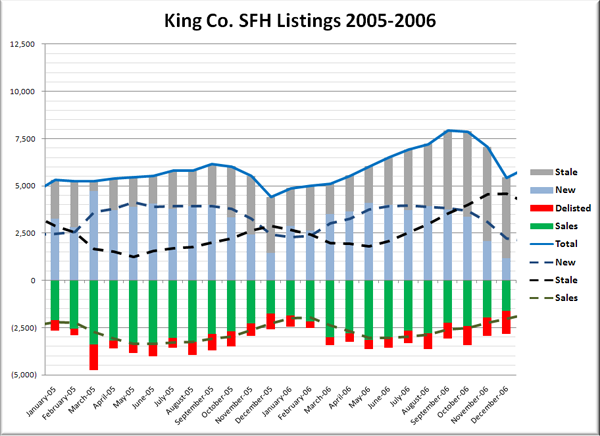
First, let’s look at the boom years of 2005 and 2006:
The dashed lines represent three-month rolling averages. You can see that during 2005 and 2006, the number of new listings averaged between 2,500 and 4,000 per month, while the number of stale listings averaged around 1,500 to 3,500 each month. 2005 had an average of 3,471 new listings a month compared to 2,019 stale. In 2006 the averages were 3,246 new and 3,034 stale.
In other words, in 2005 and 2006 there was generally more new stuff on the market each month than old, which I think most people would equate with having a good selection.
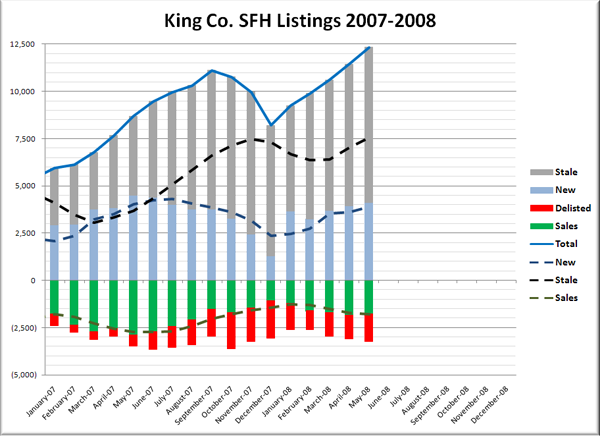
Now let’s look at 2007-Present:
During 2007 and 2008 (so far), the number of new listings has averaged between about 2,500 and 4,000 a month, which is pretty similar to 2005-2006. The average for 2007 was 3,416 new listings a month, and the average for 2008 so far has been 3,729.
The big difference between 07-08 and 05-06 is the number of stale listings, which since the second half of 2007 have shot up to between 5,000 and 7,500 a month. 2007 had an average of 5,322 stale listings a month, and January through May of this year, the average has skyrocketed to 6,958, over 3.5 times as many as the same periods in 2005 or 2006.
For those that are interested, I also generated graphs of this data for 2001-2002 and 2003-2004.
So to answer the reader’s question, I would say that while there is technically a larger selection of homes on the market right now, it is also true that the amount of new listings coming on the market each month is essentially unchanged, meaning that those that are taking their time and have already ruled out the existing inventory have no more (or less) selection than they would have in 2005 or 2006.
While I’m not making judgements about the quality of the selection, the bottom line is that during the “boom years” people were buying just about anything, as evidenced by the low number of “stale listings” each month. Now that the easy money has dried up and market psychology is beginning to shift, stuff that would have easily sold in 2005 or 2006 is just sitting. For those that are out there shopping for a home right now, I can see how the ever-increasing number of stale listings does not look much like a “better selection.”
Data Source: NWMLS

