As you may recall, a few months ago the NWMLS statistics for April showed a slight increase in prices (+2.0%) month-to-month. Well, the April Case-Shiller Home Price Index has been published, and surprisingly, they show an increase for April as well, but not nearly as much:
Up 0.7% March to April.
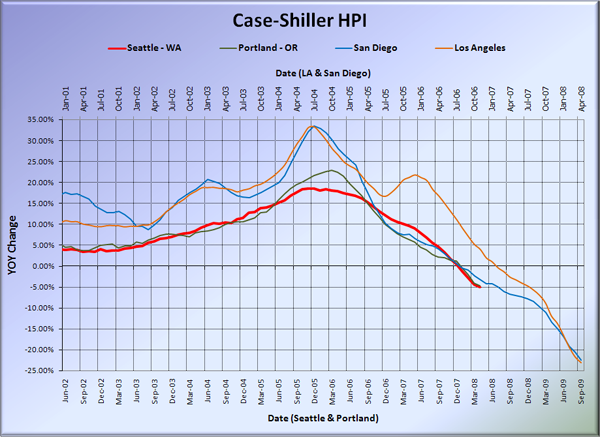
Down 4.9% YOY.
According to Case-Shiller, home prices in Seattle did get a slight spring bounce, and inched up slightly to “only” 6.6% below their July 2007 peak.
Here’s the usual graph, with L.A. & San Diego offset from Seattle & Portland by 17 months. Portland and Seattle seem to be moving in virtual lock-step for the last few months. Portland also saw a month-to-month increase in April. Both Northwest cities are performing worse than San Diego or L.A. were at this point in their downturn. This is most likely due to the financial crunch, which had not yet gained full steam 17 months ago.
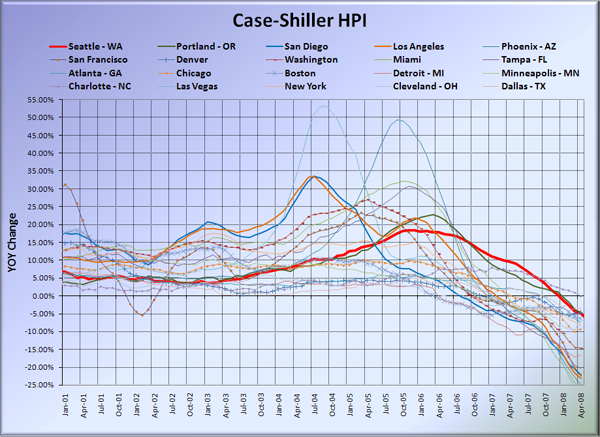
And here’s the graph of all twenty Case-Shiller-tracked cities:
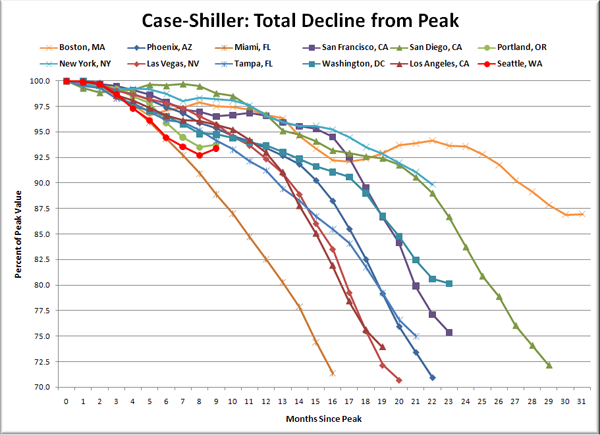
Here’s an update to the peak-decline graph, inspired by a graph created by reader CrystalBall. This chart takes the twelve cities whose peak index was greater than 175, and tracks how far they have fallen so far from their peak. The horizontal axis shows the total number of months since each individual city peaked.
Again note that Portland and Seattle both had little bumps with the most recent data. However, even with the bump, Seattle has still declined more in the nine months since its peak than 10 out of the 11 other cities on the chart, including Portland. At this point in San Diego’s decline, prices were down only 1.2%, San Francisco was down 3.5%. Those cities have now seen a total decline of 28% and 25%, respectively.
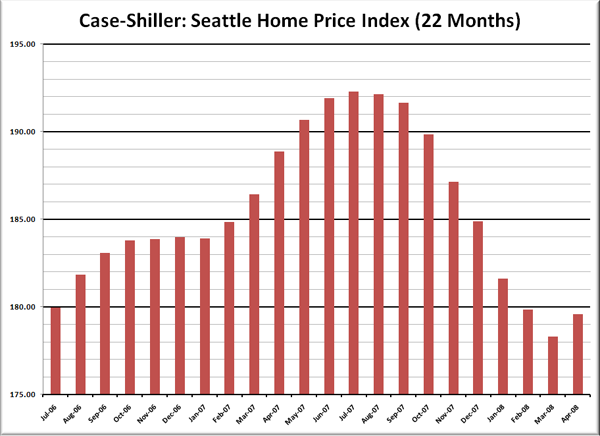
Here’s the “rewind” chart. The horizontal range is selected to go back just far enough to find the last time that Seattle’s HPI was as low as it is now. This gives us a clean visual of just how far back prices have retreated in terms of months.
With the apparent “spring bounce,” the price rewind stayed steady in April at approximately 21 months.
Still no bottom in sight down in California, which means the “it won’t get as bad here” talk still doesn’t really have a baseline to compare with. I highly doubt that March was the bottom for Seattle. You can see that a number of other cities have bounced up and down on their way down to 20%+ declines, and that is probably all that’s happening here.
Check back tomorrow for a post on the Case-Shiller data for Seattle’s price tiers.
(Home Price Indices, Standard & Poor’s, 06.24.2008)


