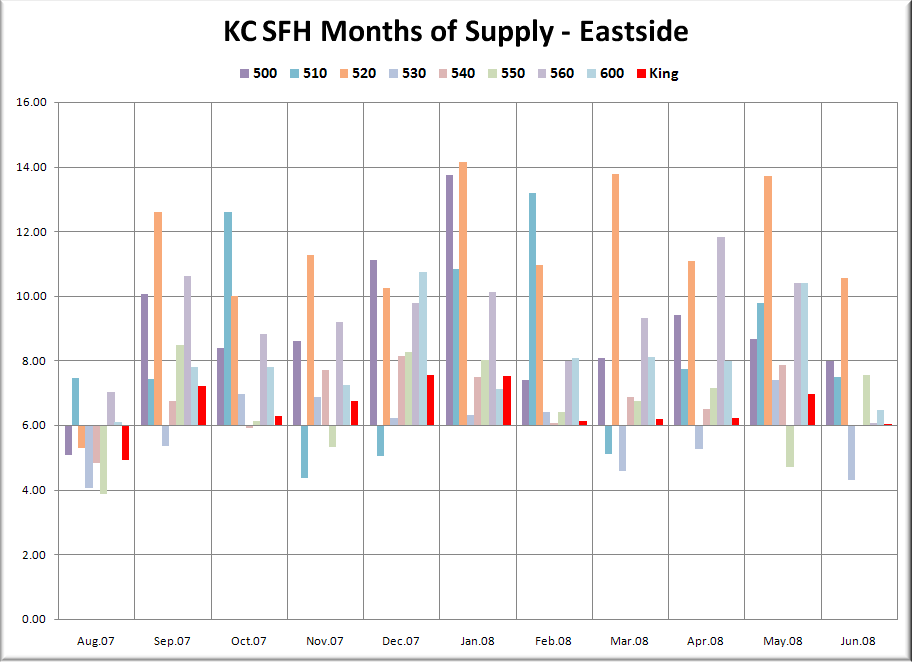
Here’s the latest update on months of supply, or “absorption rates” for the 30 NWMLS areas in King County. For an explanation of what months of supply means, please refer to the original neighborhood MOS breakdown post. I apologize for the tardiness, I was hoping to have the color-coded map ready by this month’s update, but no luck. You can still see a good map of these areas here though.
Remember: Over 6 MOS is a buyer’s market, which gives buyers more negotiating power, but doesn’t mean homes are priced attractively for buyers or that it’s a good time to buy. Before this year, the longest that King County as a whole has sustained a MOS above 6 was 4-5 months in the winter of 1994-1995. June MOS for King County came in at 6.04 (compared to 3.50 for June 2007), bringing the current run to ten months.
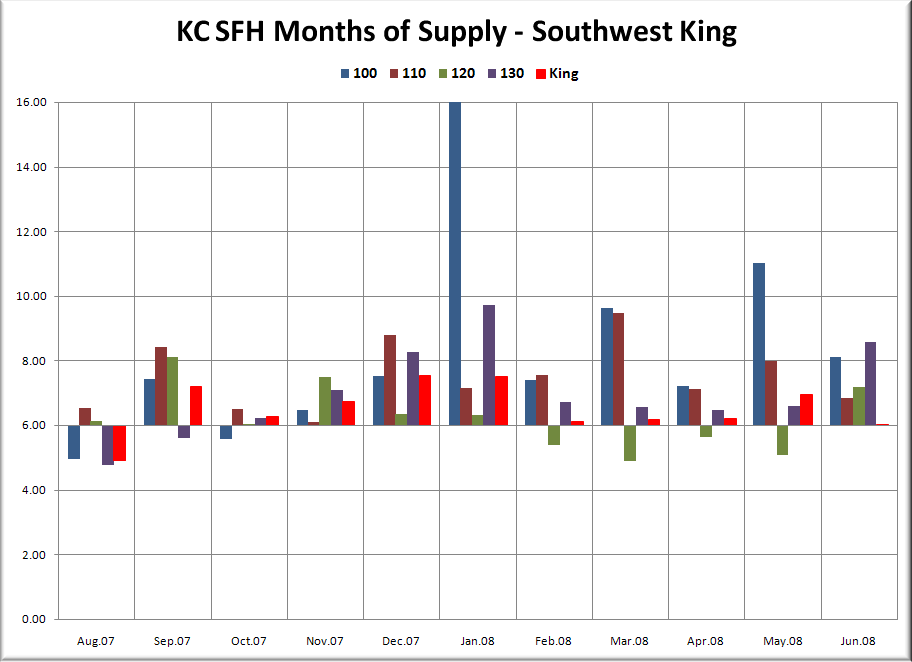
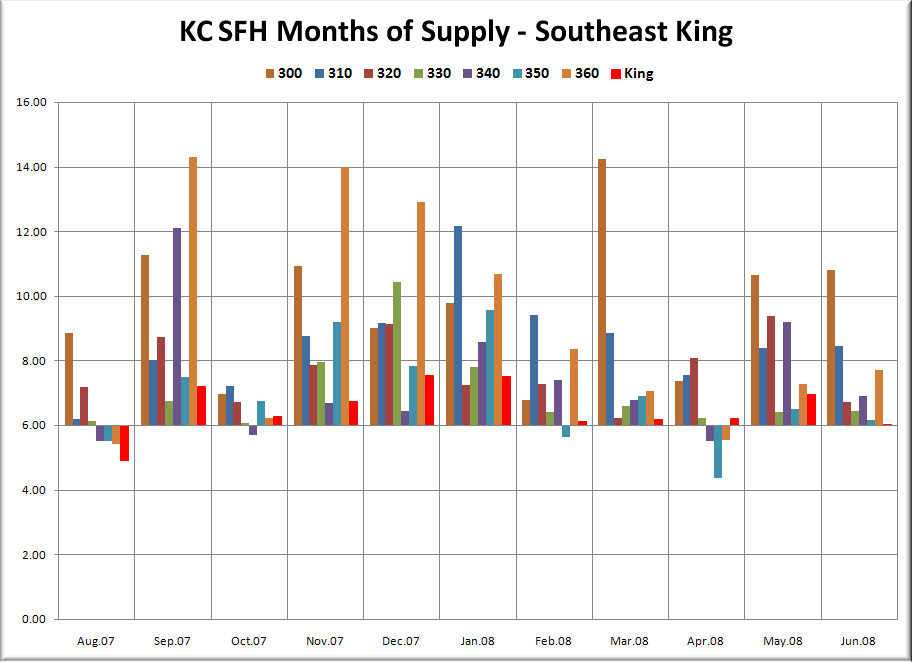
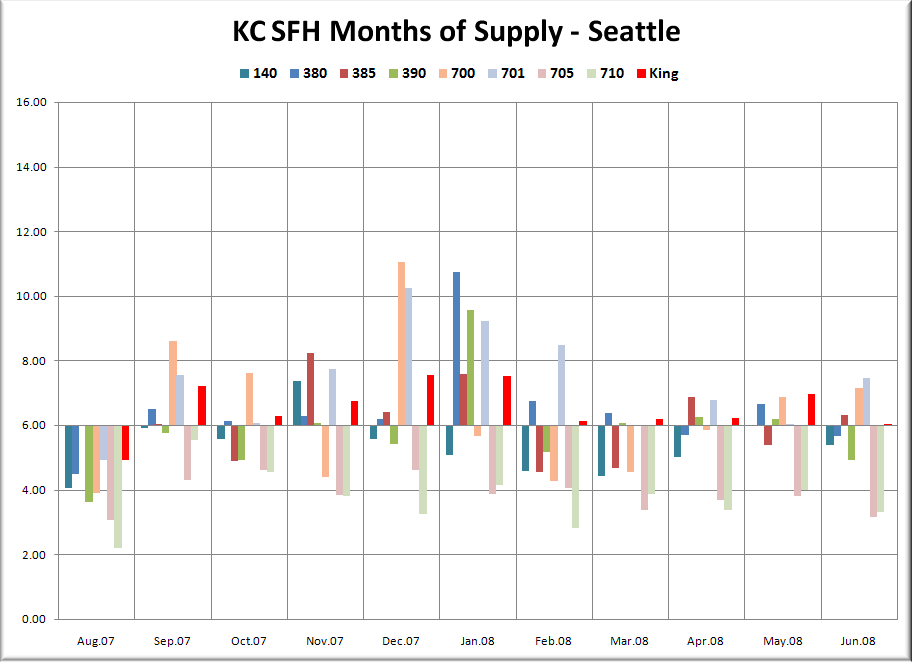
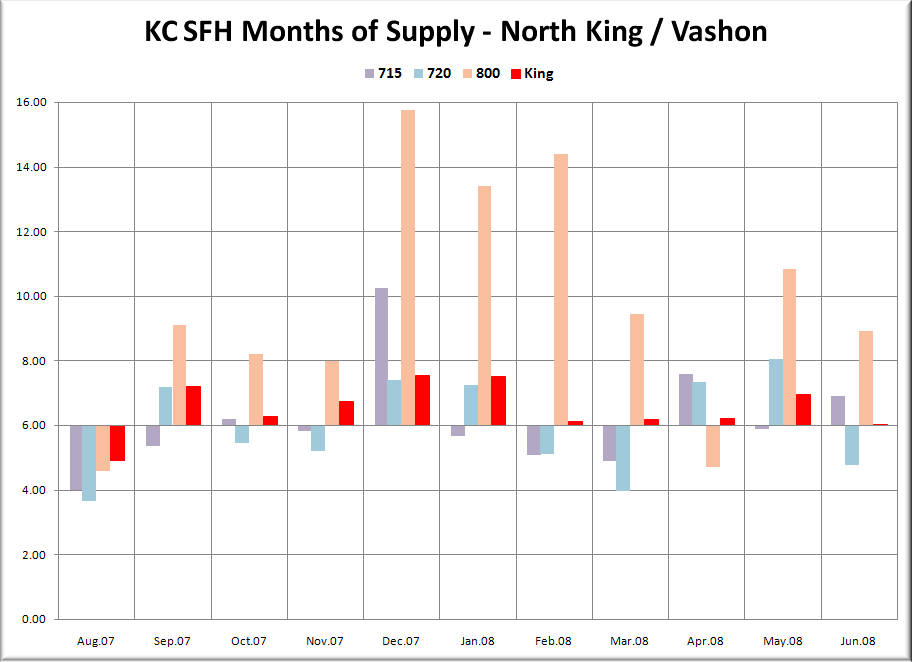
In the graphs below, you’re looking at the MOS for the “Res Only” data from the NWMLS King County Breakout pdfs for the eleven-month period of July 2007 through June 2008. The bar graph is centered vertically on 6.0 MOS, so that it is easier to visually tell the difference between a seller’s and buyer’s market (i.e. – shorter bars mean a more balanced market). Each graph again has the same scale on the vertical axis and has the King County aggregate figure plotted in red on the far right, so they can be easily compared.
Note: Area 100 MOS was over 21 in January, and has been clipped.
Note: For Area 701 (Downtown Seattle) we’re using condo data.
Outside of the Seattle city limits, only areas 720 (Lake Forest Park / Kenmore) and 530 (East Bellevue) were seller’s markets. Within the city of Seattle, only three of eight areas were buyer’s markets: 385 (Beacon Hill), 700 (Queen Anne / Magnolia), and 701 (Downtown Condos). Last month six neighborhoods in King County were below 6.0 MOS. This month there were seven.
The cumulative MOS for Seattle proper dropped from 5.2 in May to 4.6 in June, up from 2.6 in June 2007. The Eastside also saw overall MOS drop, but stayed in buyer’s market territory with 6.5 MOS.
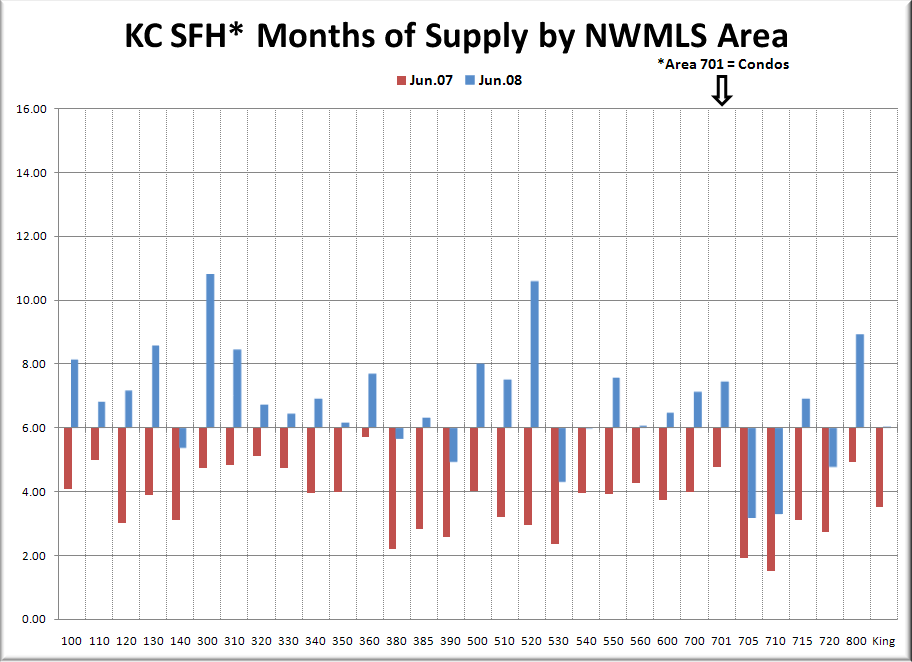
Here’s the bonus graph, which lets you directly compare each area’s MOS to its value one year ago. June 2007 is in red, and 2008 is in blue.
Yet again, every area was more of a buyer’s market in June than it was at this time last year, with MOS doubling in many regions.
The three toughest markets for sellers were Enumclaw (300) at 10.79, Medina / Clyde Hill / W. Bellevue (520) at 10.57, and Vashon Island (800) at 8.92. 520 is now in its tenth straight month of 10+ MOS.
The three best markets for sellers as of last month were Ballard/Greenlake/Greenwood (705) at 3.17, North Seattle (710) at 3.32, and East Bellevue (530) at 4.31.
