Last month’s Case-Shiller data showed a slight increase in prices month to month, possibly signaling the end of the bust for Seattle. Or not. This month’s Case-Shiller Home Price Index would seem to indicate that the bust is not over yet.
Down 0.5% April to May.
Down 6.3% YOY.
Last year prices rose 0.95% from April to May, so the year-over-year figure for the index has once again set a new record as it punches through the 5% threshold.
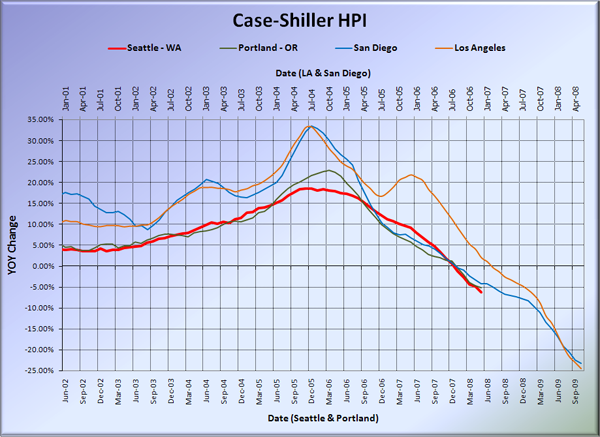
Here’s the usual graph, with L.A. & San Diego offset from Seattle & Portland by 17 months. Portland actually increased again in May, but still had an over 5% year-over-year decline. Both Northwest cities continue to perform worse than San Diego or L.A. did at this point in their downturn. This is most likely due to the financial crunch, which had not yet gained full steam 17 months ago.
Again I’d like to point out that this graph is not intended to be predictive. That said, it is interesting to note how closely Portland and Seattle have tracked San Diego since the first time I posted this graph just over a year ago.
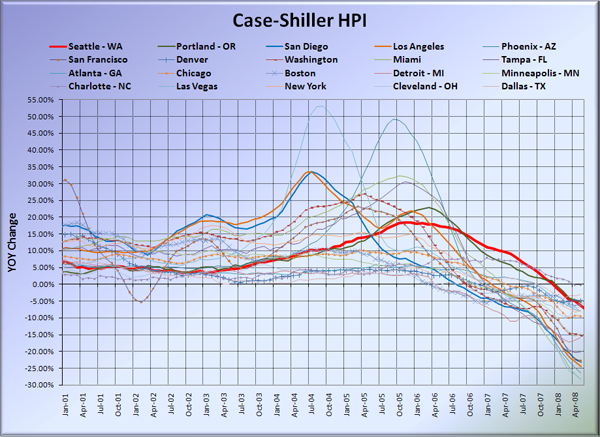
And here’s the graph of all twenty Case-Shiller-tracked cities:
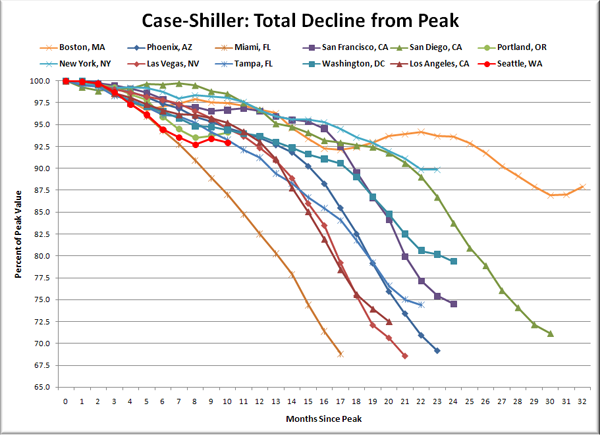
Here’s an update to the peak-decline graph, inspired by a graph created by reader CrystalBall. This chart takes the twelve cities whose peak index was greater than 175, and tracks how far they have fallen so far from their peak. The horizontal axis shows the total number of months since each individual city peaked.
Seattle’s drop ten months off of the peak is still larger than 10 out of the 11 other cities on the chart, including Portland. At this point in San Diego’s decline, prices were down only 1.5%, San Francisco was down 3.3%. Those cities have now seen a total decline of 29% and 25%, respectively.
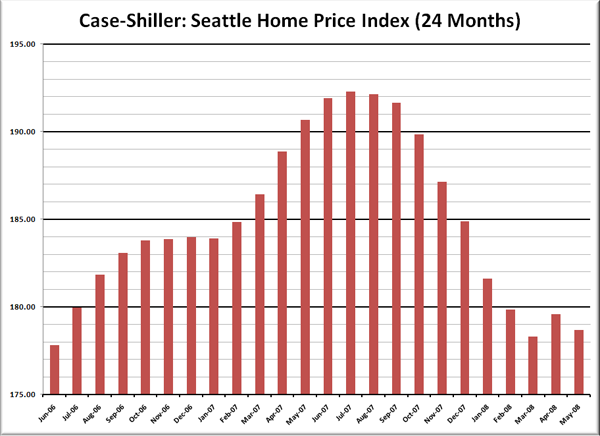
Here’s the “rewind” chart. The horizontal range is selected to go back just far enough to find the last time that Seattle’s HPI was as low as it is now. This gives us a clean visual of just how far back prices have retreated in terms of months.
Even with the month-to-month drop, May’s index for Seattle (178.67) was still slightly higher than March (178.29), so I guess we still can’t say with certainty that March wasn’t the bottom. But let’s just say I won’t be surprised to see the index drop again in June.
It is also worth noting that with year-over-year price drops now over 6%, two prominent local real estate insiders have already had their 2008 predictions proven wrong. Matthew Gardner: “For 2008, Gardner is predicting anywhere from zero appreciation to home prices falling as much as 5 percent.” Dick Conway: “Conway anticipates average Puget Sound-region home prices will decline less than 1 percent next year…”
Check back tomorrow for a post on the Case-Shiller data for Seattle’s price tiers.
(Home Price Indices, Standard & Poor’s, 07.29.2008)


