All right, after a bit of a technical glitch yesterday, things seem to be back to normal today, so it’s time for NWMLS July statistics.
Here’s the NWMLS press release: July’s Pending Home Sales Dip Slightly From June, Prices Edge Up.
Here is your summary along with the usual graphs and other updates.
Here’s your King County SFH summary:
July 2008
Active Listings: up 24% YOY
Pending Sales: down 24% YOY
Median Closed Price*: $445,000 – down 7.5% YOY
Here is the updated Seattle Bubble Spreadsheet, and here’s a copy in Excel 2003 format. Click below for the graphs and the rest of the post.
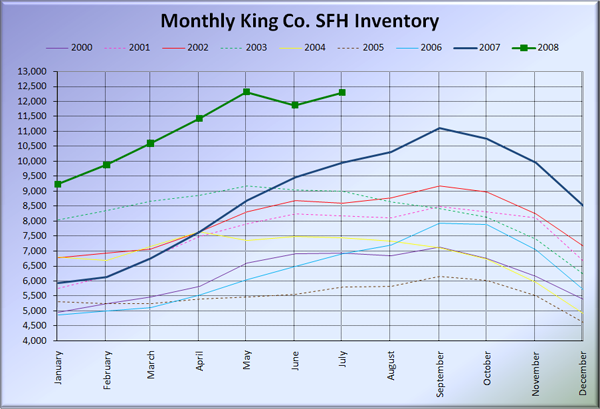
Here’s the graph of inventory with each year overlaid on the same chart.
Inventory bumped back up in July, but didn’t quite reach the level set in May. We may have finally reached somewhat of a plateau in inventory.
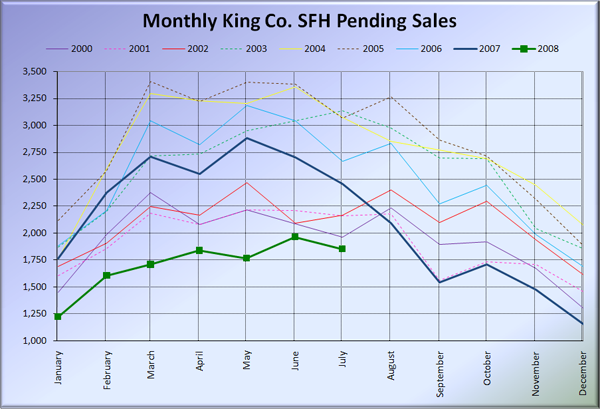
Pending sales have fallen almost every year from June to July, and this year was no exception. Sales dropped to 1,855 last month, continuing this year’s streak of marking the lowest months on record every month. At this pace, it seems quite possible that there will be fewer than 1,000 single-family home sales in all of King County in December.
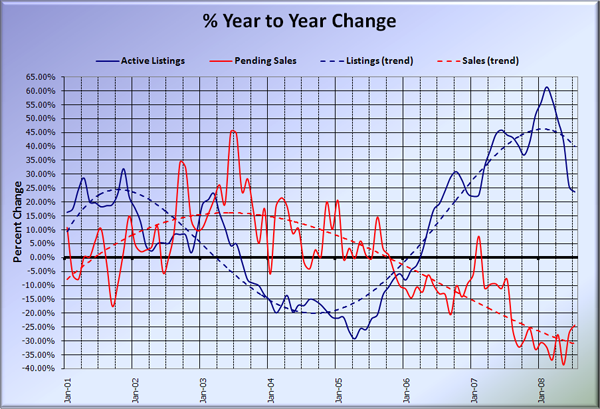
Here’s the supply/demand YOY graph.
While they are both moderating somewhat, the overall trend is still one of growing inventory and shrinking sales volume.
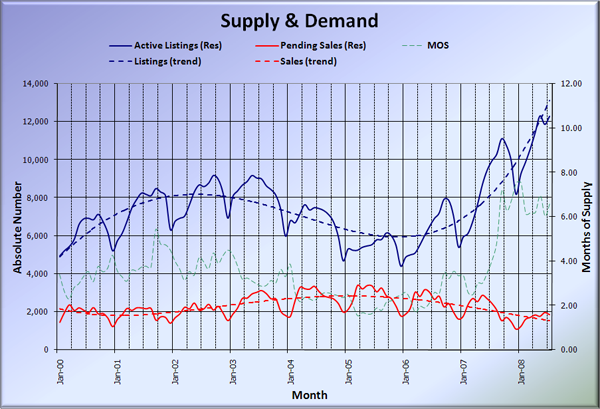
Here’s the chart of supply and demand raw numbers:
Months of supply bounced back up again to 6.6, bringing King County to within one month of marking down a full year above the 6.0 “buyer’s market” level. I guess it’s a great time to buy? (sarcasm)
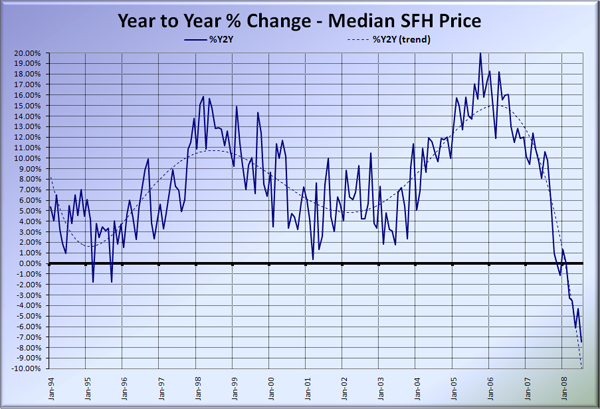
Here’s the SFH Median YOY change graph.
As predicted last month, June’s upward tick simply appears to be noise on the way down. July’s 7.5% drop marked a new record year-over-year decline for the median. It’s worth pointing out that most years, prices either flatten out or drop from July through December.
Based on July’s data, it looks like we’re still searching for the bottom in the local housing market. Come back later today for the news roundup to see what your local agents are saying about the numbers.
Here are the Times and P-I links I posted earlier:
Seattle Times: Homes sales, prices fall around Puget Sound
Seattle P-I: King County house prices down in July
