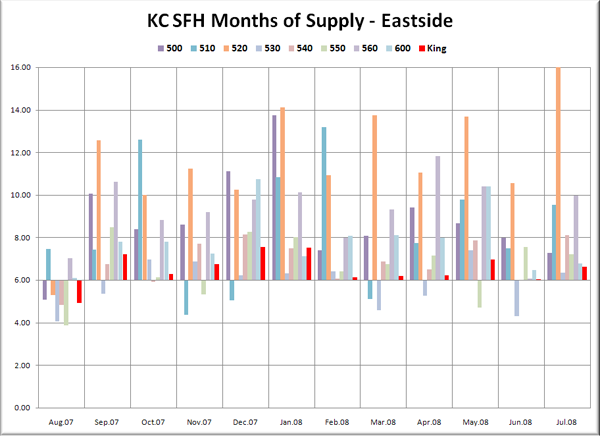
Here’s the latest update on months of supply, or “absorption rates” for the 30 NWMLS areas in King County. For an explanation of what months of supply means, please refer to the original neighborhood MOS breakdown post. Don’t forget you can view a map of these areas here.
Remember: Over 6 MOS is a buyer’s market, which gives buyers more negotiating power, but doesn’t mean homes are priced attractively for buyers or that it’s a good time to buy. Before this year, the longest that King County as a whole has sustained a MOS above 6 was 4-5 months in the winter of 1994-1995. July MOS for King County came in at 6.62 (compared to 4.06 for July 2007), bringing the current run to eleven months.
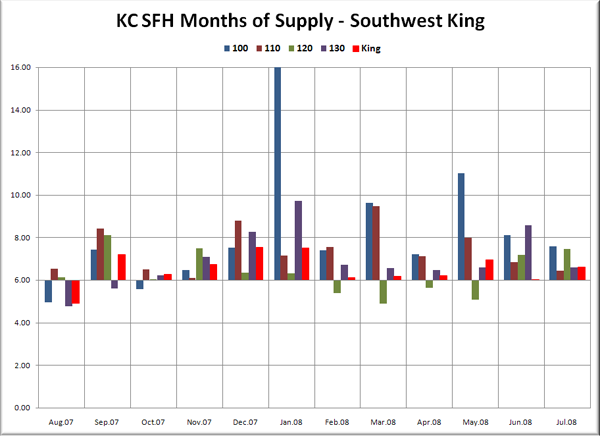
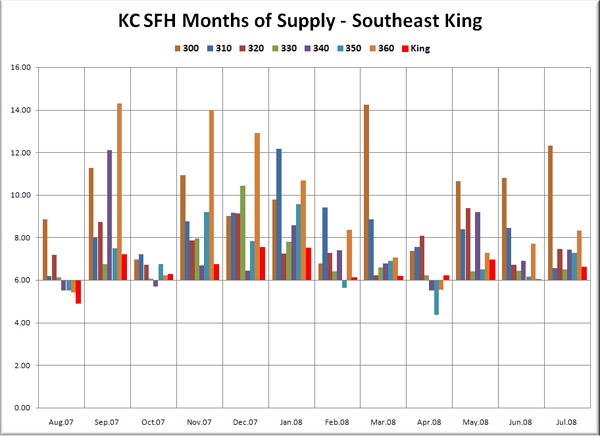
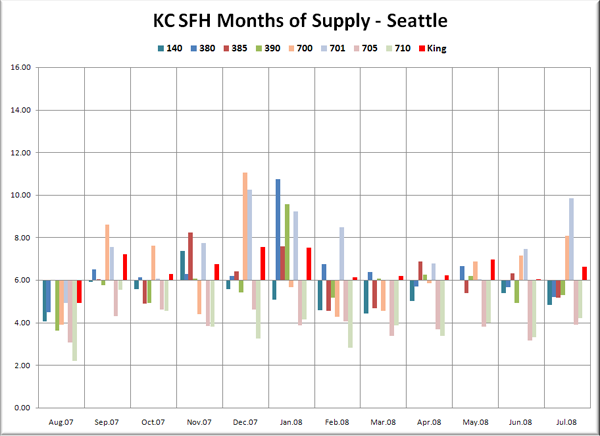
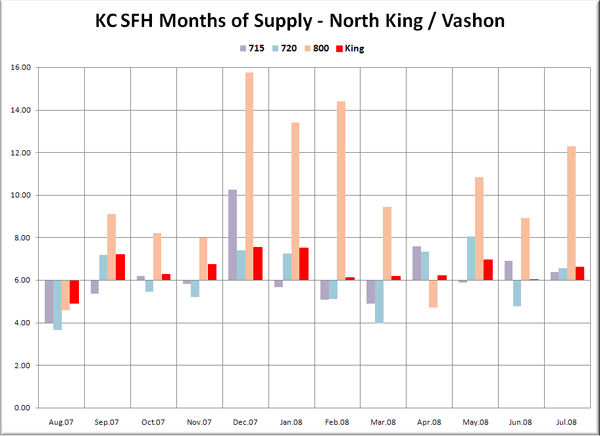
In the graphs below, you’re looking at the MOS for the “Res Only” data from the NWMLS King County Breakout pdfs for the one-year period of August 2007 through July 2008. The bar graph is centered vertically on 6.0 MOS, so that it is easier to visually tell the difference between a seller’s and buyer’s market (i.e. – shorter bars mean a more balanced market). Each graph again has the same scale on the vertical axis and has the King County aggregate figure plotted in red on the far right, so they can be easily compared.
Note: Area 100 MOS was over 21 in January, and has been clipped.
Note: For Area 701 (Downtown Seattle) we’re using condo data.
Note: Area 520 MOS was over 19 in July, and has been clipped.
Not a single neighborhood outside the Seattle city limits was a seller’s market in July. The city of Seattle seems to be the last holdout of home sellers in King County, with only two areas in the city coming in as buyer’s markets, 700 (Queen Anne / Magnolia) and 701 (Downtown Condos).
The cumulative MOS for Seattle proper increased from 4.6 in June to 5.1 in July, up from 3.0 in July 2007. The Eastside as a whole shot up to just under 8.0 MOS, nearly double July 2007’s 4.2.
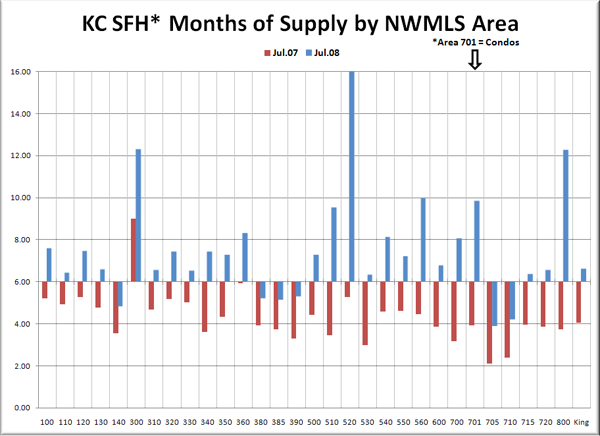
Here’s the bonus graph, which lets you directly compare each area’s MOS to its value one year ago. July 2007 is in red, and 2008 is in blue.
Every area was more of a buyer’s market in July than it was at this time last year.
The three toughest markets for sellers were Medina / Clyde Hill / W. Bellevue (520) at 19.47 (yikes!), Enumclaw (300) at 12.31, and Vashon Island (800) at 12.27. 520 is now just one month away from a one-year streak of 10+ MOS.
The three best markets for sellers as of last month were Ballard/Greenlake/Greenwood (705) at 3.91, North Seattle (710) at 4.20, and West Seattle (140) at 4.83. Seeing West Seattle on that list is a particular surprise, given the number of flops we’ve seen in that neighborhood in recent months.
