There has been some talk lately about the overall housing stock in the Seattle area, and whether construction has been able to keep up with population growth, or if there is a housing shortage that will lead to another housing boom in a few years. So I thought now would be a good time to revisit an old post from October 2006—Big Picture: Supply vs. Demand.
For the charts below I have taken data on the number of households and the number of housing units from the annual American Community Survey results from 2000 through 2007.
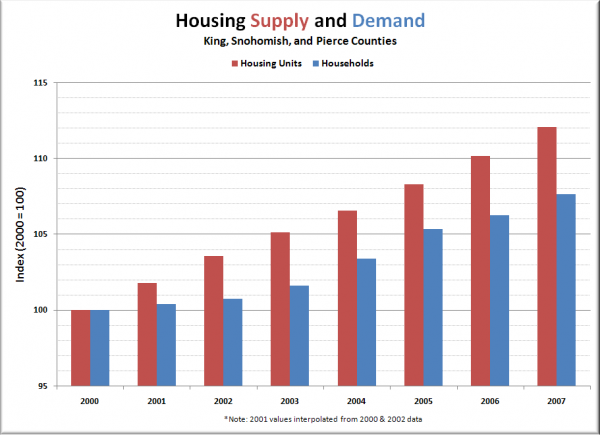
Here’s what the housing supply and demand picture looks like for King, Snohomish, and Pierce counties combined, indexed to 100 in 2000.
Puget Sound housing supply increased 12.1% from 2000 to 2007, while the number of households increased only 7.6%. In terms of raw numbers, population increased by 92,911 households during that time, while 151,710 housing units were added, resulting in an oversupply of 58,799 housing units for the 7-year period. In other words, from 2000 through 2007, 1.6 new housing units were constructed for every new household.
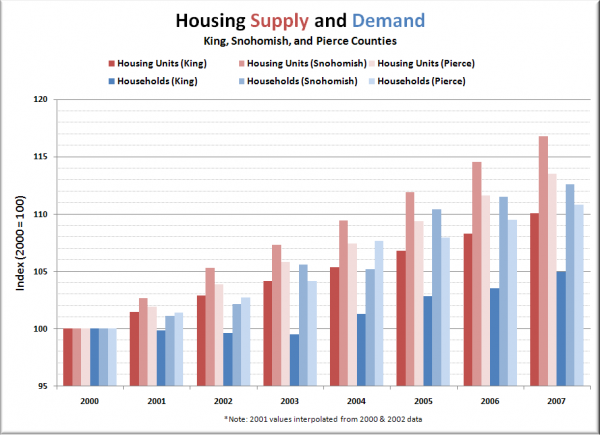
Here’s the same data as above, broken down by county:
Surprisingly, the overbuilding was most dramatic in King County, where 74,608 housing units were added for a mere 35,905 households, providing 2.1 new housing units for every new household. Snohomish and Pierce were roughly the same as each other, coming in at 1.4 and 1.3 new housing units per new household, respectively.
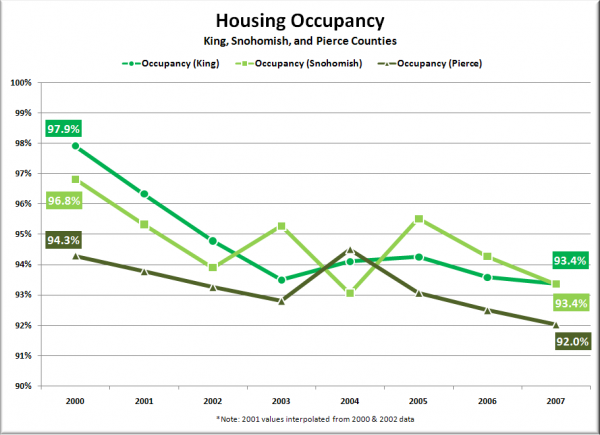
Here’s a slightly different take on the data, showing the percent occupancy rate from 2000 through 2007 for each of the three counties.
Occupancy has been steadily declining this decade in all three counties, with 2007 setting a low point in King County that has not been matched since the 1970 Census.
So please, tell me again how there’s a housing shortage in the Seattle area. I enjoy fairy tales.


