There’s been a lot of talk lately about whether or not the Seattle-area real estate market is “at bottom.”
Before I go any further, I should point out that as a practical matter, I think that it doesn’t really matter where the absolute bottom is. As I have always said:
If you find a home that you love, at a price that you’re comfortable paying (i.e. – you wouldn’t be upset if the price dropped another 10-20%), and you plan to live there for a long time, then go for it.
During the real estate bubble, people were buying homes based primarily on the hope of future appreciation, which led to a mindset of “there’s no such thing as an overpriced house.” If you’re buying a house you can afford, primarily as a place to live, and are paying a price you are happy with, who really cares whether or not we’re “at bottom”? So the price drops another 25%, so what? You were happy with the price you paid, right?
However, I’m not ignorant. I realize that the question of when we will hit bottom is one that interests many people. That’s why I am making this week Bottom-Calling Week on Seattle Bubble. In keeping with the statistics-focused nature of this site, we’ll be using a variety of statistical methods to attempt to forecast when the Seattle-area real estate market will hit bottom, and at what price point (expressed as a percentage drop from the peak).
Here’s how the week will be structured:
- Introduction: Bottom-Calling Week on Seattle Bubble
- Method 0: Blind Optimism
- Method 1: Inventory-Based Forecast
- Method 2: Dollars per Square Foot Linear Forecast
- Method 3: Simple Mirror Forecast
- Method 4: Affordability Index Forecast
- Method 5: San Diego Lag Forecast
- Conclusion: So Where’s the Bottom?
Continue reading this post for Method 0: Blind Optimism. Method 1: Inventory-Based Forecast will be posted at noon today. The remaining methods will be posted each morning this week at 6:00, and the conclusion will go live at noon on Friday.
Bottom-Calling: Blind Optimism
Our first method of “analysis” has been deemed “Blind Optimism.” As best I can tell, this is roughly equivalent to the method Ardell is using in her “at bottom” post, where her reasoning seems to be something along the lines of “homes are selling at X price, so this must be the bottom.”
Here are our basic assumptions for the Blind Optimism forecast.
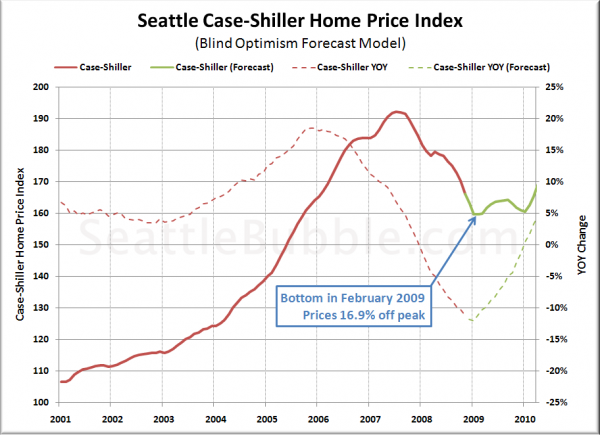
- January 2009 was the lowest month for YOY negative home price changes.
- YOY home price appreciation will ramp back up to 0% at the same rate it declined from 0%.
Given these assumptions, here’s a rough picture of what Seattle’s Case-Shiller Home Price Index would look like through early 2010:
The Blind Optimism forecast method gives us a price floor in February 2009 at 16.9% off the July 2007 peak. Home prices increase slightly leading into the summer, but retreat back almost to the bottom again by early 2010.
Frankly, I see little to no reason from a statistical standpoint to believe that reality will even slightly resemble this forecast. Year-over-year home price declines in Seattle are accelerating by all measures, as area job losses mount and nationwide economic pressures increase. In my opinion, this forecast is the least likely to come true.
Method 0: Blind Optimism (Summary)
Bottom Month: February 2009
Bottom Value: 16.9% off peak
Likelihood*: 5%
* Likelihood is a totally subjective value assigned according to The Tim’s gut feeling. Treat it accordingly.
