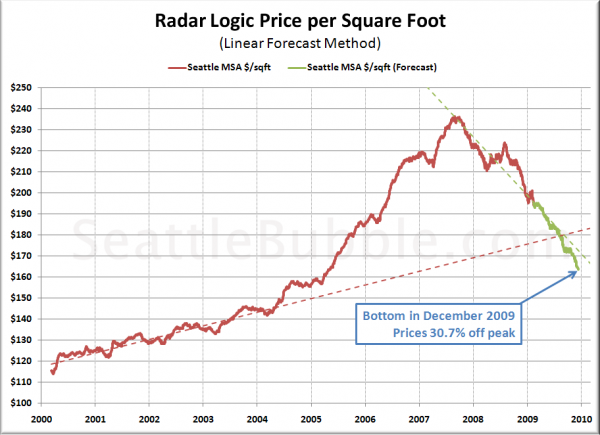
For our next forecast, let’s refer to a dataset that we’ve only gone to once before on Seattle Bubble: Radar Logic’s Residential Property Index.
Radar Logic analyzes home sales and produces a running index of sale prices in the Seattle metro area in terms of dollars per square foot.
Here are our basic assumptions for the Dollars per Square Foot Linear forecast:
- The 2000 to early 2004 trendline for Seattle home prices represents a reasonable baseline.
- Prices on a $/sqft basis will continue falling at present rate.
- The bottom will be 10% below the historical trend line.
Given these assumptions, here’s a rough picture of what Seattle’s Radar Logic Residential Property Index would look like through late 2009:
Using the Dollars per Square Foot Linear forecast model, Seattle-area home prices (as measured by Radar Logic) will hit bottom late this year to early next year.
This method seems to give us a fairly reasonable prediction. The historical trend (red dashed line in the chart above) represents home price growth of approximately 5% per year in the years just prior to the housing bubble. Of course, it is certainly open for debate whether 5% annual growth is truly sustainable in the long-term, and whether 10% below that trendline is a reasonable bottom. If you believe, as some do, that unsustainable price growth has been taking place since the late ’90s, the bottom would obviously be much later and lower than shown above.
Also note that this forecast method and the three that remain in Bottom-Calling Week do not forecast any further into the future than the bottom month. Once the bottom is reached, the forecast is halted.
Method 2: Dollars per Square Foot Linear Forecast (Summary)
Bottom Month: December 2009
Bottom Value: 30.7% off peak
Likelihood*: 20%
* Likelihood is a totally subjective value assigned according to The Tim’s gut feeling. Treat it accordingly.
Bottom-Calling Week on Seattle Bubble
- Introduction: Bottom-Calling Week on Seattle Bubble
- Method 0: Blind Optimism
- Method 1: Inventory-Based Forecast
- Method 2: Dollars per Square Foot Linear Forecast
- Method 3: Simple Mirror Forecast
- Method 4: Affordability Index Forecast
- Method 5: San Diego Lag Forecast
- Conclusion: So Where’s the Bottom?
