As regular readers of Seattle Bubble are aware, one of the most popular (and simultaneously one of the most controversial) charts we publish on a regular basis is the “Behind the Cycle” graph, which shows the year-over-year changes in Seattle and Portland’s Case-Shiller HPIs offset by 17 months from the YOY changes in the HPIs for San Diego and Los Angeles.
Ever since we first introduced this graph in June 2007, we have stated that it is totally speculative, not intended to be predictive, and for entertainment purposes only. Of course, in the twenty months since then, the lines have continued to track amazingly close together. So what the heck, let’s see what things might look like if the San Diego lag were predictive.
Our final bottom-calling forecast is based on the premise that YOY changes in Seattle’s Case-Shiller HPI will continue to track closely to San Diego’s performance from 17 months prior.
Here are our basic assumptions for the San Diego Lag forecast:
- Seattle’s peak YOY drop will be ~45% lower than San Diego’s.
(Seattle’s peak YOY increase (18.5%) was ~45% lower than San Diego’s (33.5%).) - San Diego’s peak YOY drop will have been October 2008 at -26.7%.
- Therefore, Seattle’s peak YOY drop will be 14.7%.
- Seattle’s peak YOY drop will come 17 months after San Diego’s, in March 2010.
- YOY price changes will move back to zero at the same rate they fell from zero.
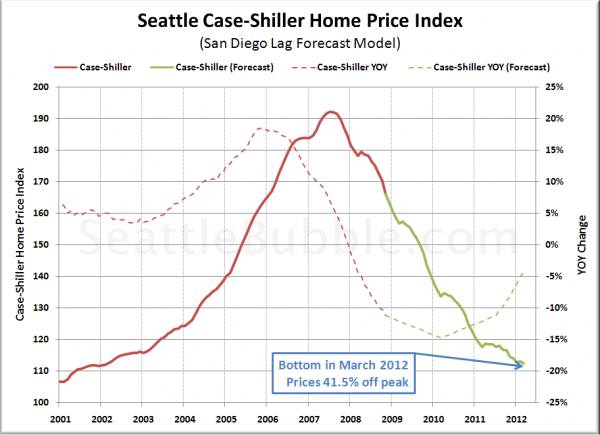
Given these assumptions, here’s a rough picture of what Seattle’s Case-Shiller Home Price Index would look like through early 2012:
Using the San Diego Lag forecast model, Seattle-area home prices (as measured by the Case-Shiller HPI) will hit bottom in early 2012, giving up a little over 40% of their peak values.
The price point at the bottom using this forecast is similar to yesterday’s Affordability Index Forecast, but the timeline is extended out slightly over a year further.
In my opinion, this so-called forecast is based on too many unknowns to be of much worth. Has San Diego really seen the end of increasingly negative YOY price changes? We’ve only got a single month of increasing YOY values, which certainly can’t be called a trend. Furthermore, even if YOY price drops in SoCal have reached their most extreme point, what’s to say they won’t just languish in the -20% to -25% range for a year?
In the end, I stand by my monthly disclaimer on the “Behind the Cycle” chart. Any bottom-calling based on something as tenuous as an apparent 17-month lag with no real firm explanation behind it can only really be considered entertainment.
Method 5: San Diego Lag Forecast (Summary)
Bottom Month: March 2012
Bottom Value: 41.5% off peak
Likelihood*: 10%
* Likelihood is a totally subjective value assigned according to The Tim’s gut feeling. Treat it accordingly.
Bottom-Calling Week on Seattle Bubble
- Introduction: Bottom-Calling Week on Seattle Bubble
- Method 0: Blind Optimism
- Method 1: Inventory-Based Forecast
- Method 2: Dollars per Square Foot Linear Forecast
- Method 3: Simple Mirror Forecast
- Method 4: Affordability Index Forecast
- Method 5: San Diego Lag Forecast
- Conclusion: So Where’s the Bottom?
